
The services performance report: how much do services really bring in?
In a business selling both products and services, the services disappear among the goods figures. This report pulls them out on their own.
Steps
- Open Sales → Sales Reports and press Services Report at the top — image 1.
- Set from and to dates, and pick a branch or leave it on all branches.
- Press Filter, then Export Excel if you want a file.
What it shows
Four cards at the top: total revenue, total quantity sold, total transactions and average per transaction.
Then a row per service: SKU, name, quantity sold, transactions, total and its share of revenue, sorted so the highest earner leads.
How to read it
- Average per transaction exposes your pricing: a low average with many transactions means small, exhausting jobs; revisit your minimum order.
- Share of revenue shows what your income really rests on. One service at 70% means a risky dependence on a single source.
- Quantity versus transactions: high quantity over few transactions means large customers; look after them.
- A service with zero revenue all period is a candidate for deactivation, to keep your pickers clean.
Notes
- The report covers items of type service only; products have Top Products under the Advanced tab.
- Services deduct no stock and never appear in balance reports, so this is the only place their performance is measured.
- If you see "No services found for this period", either the period is empty or you are recording your services as items of type "product" — check your item types.
- A user restricted to a branch sees only that branch's figures.
Screenshots
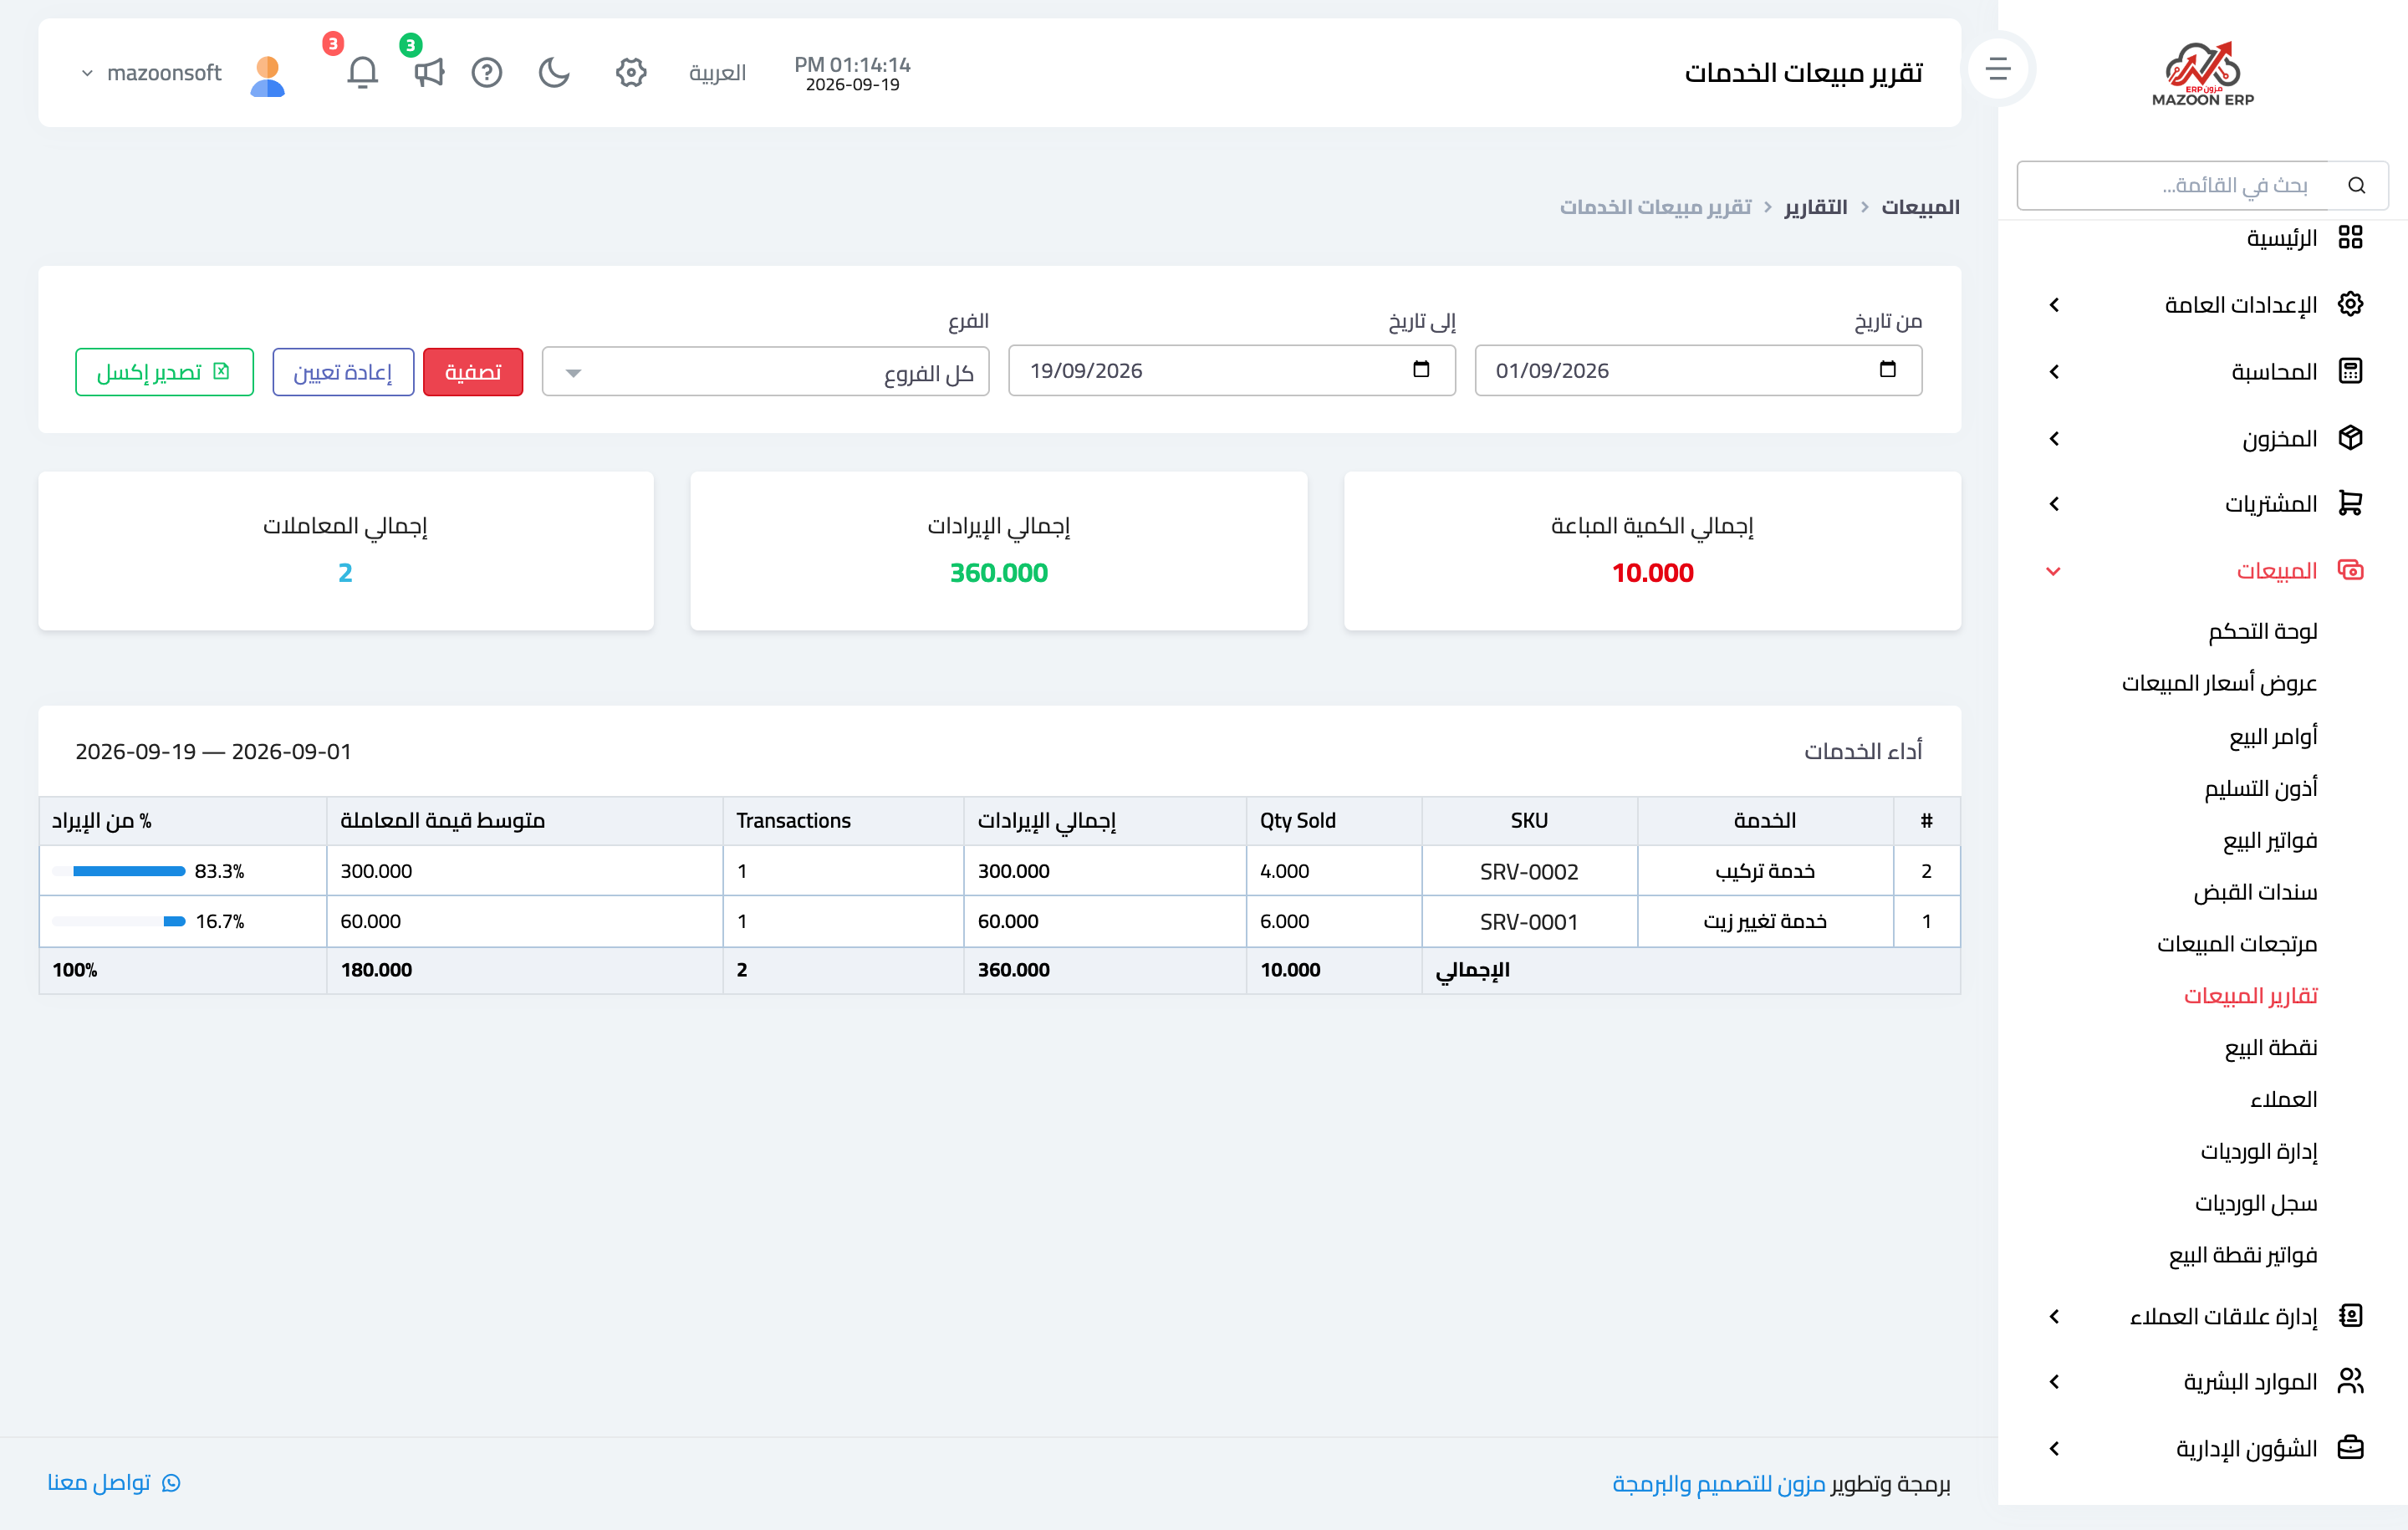
Figure 1
Try what you just read on your own data
Open a free 7-day trial — no credit card, with your own company link in minutes.