
Sales reports and the activity log
Once sales are recorded with discipline, the reports become a decision tool rather than a pile of numbers: what do we sell, who buys, and what has not been collected yet?
The sales reports page
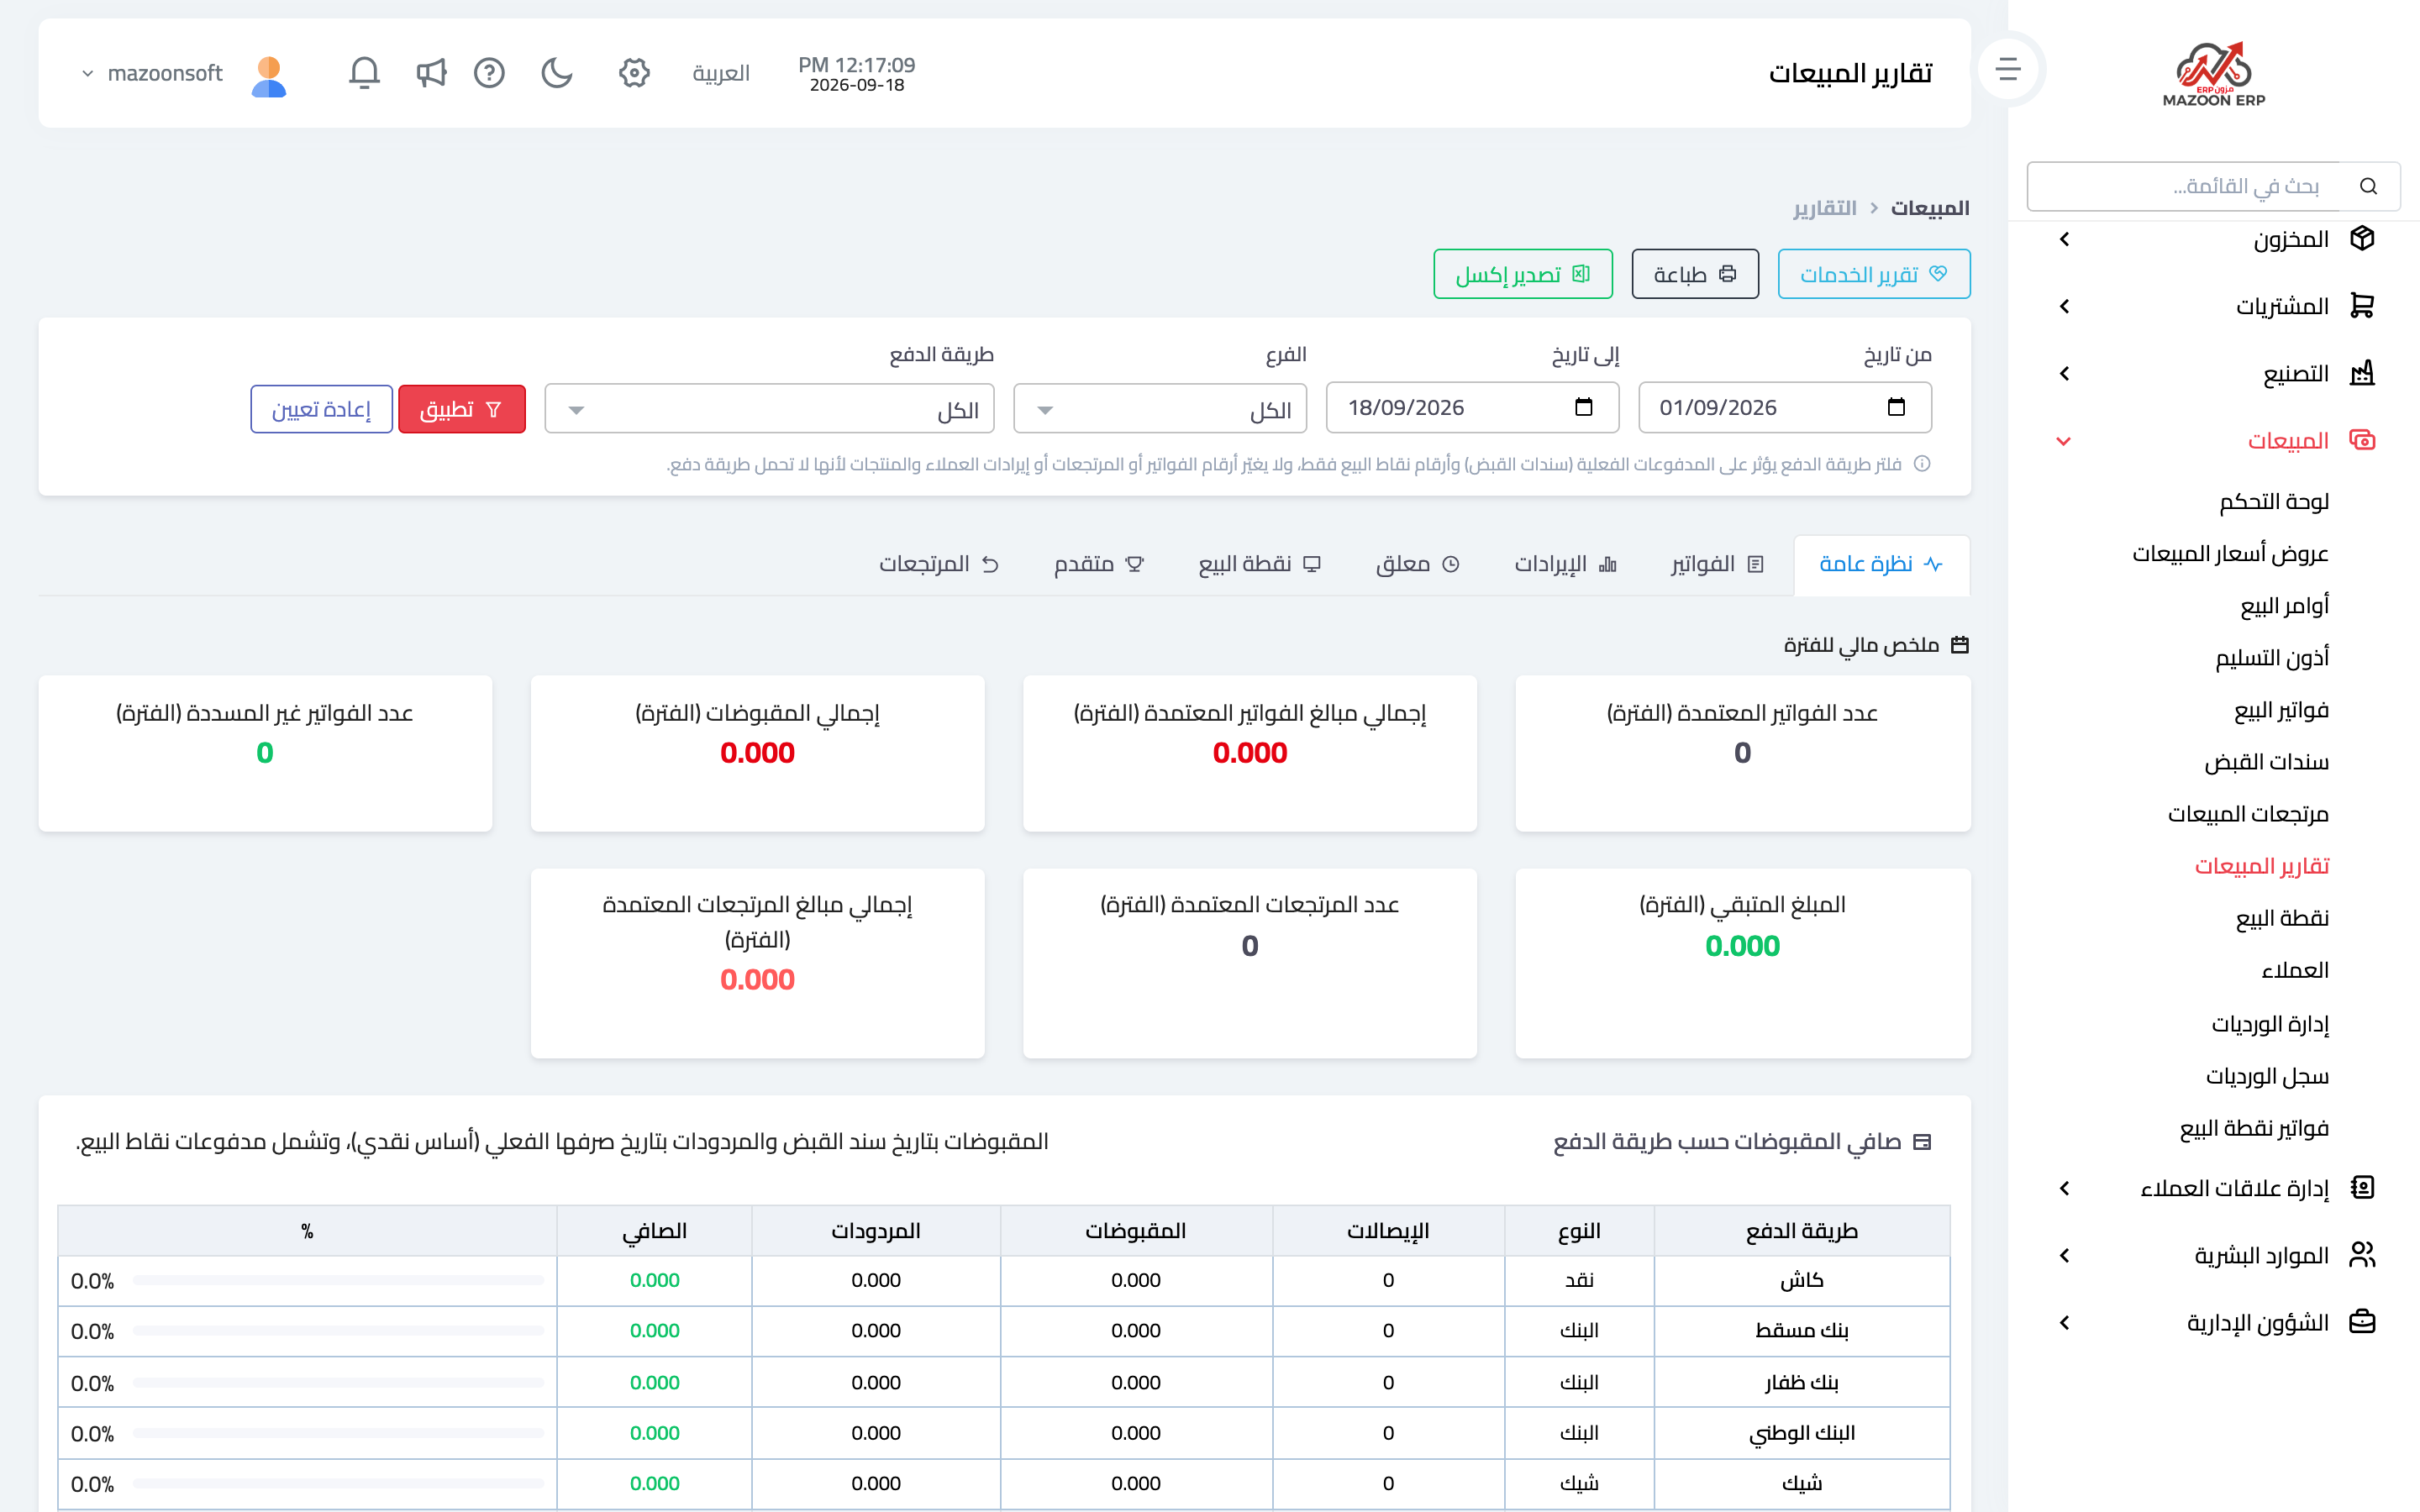
From the sales dashboard open the Reports card — image 1. Choose a date range and a branch, then read:
- Total sales for the period, spread across days or months.
- Sales by item — what sells most, the basis of buying and display decisions.
- Sales by customer — who actually makes up most of your revenue.
- Sales by branch or terminal — comparing performance.
- Returns — their value and share of sales; a high rate on one item signals a problem with the product or with how it is described at the point of sale.
Every report has print and export buttons.
A warning about reading the numbers
Always distinguish sales (invoices approved during the period) from collections (money actually received, dated by its voucher). In credit selling these are different by nature, and comparing one against the other is a common source of confusion.
The sales activity log
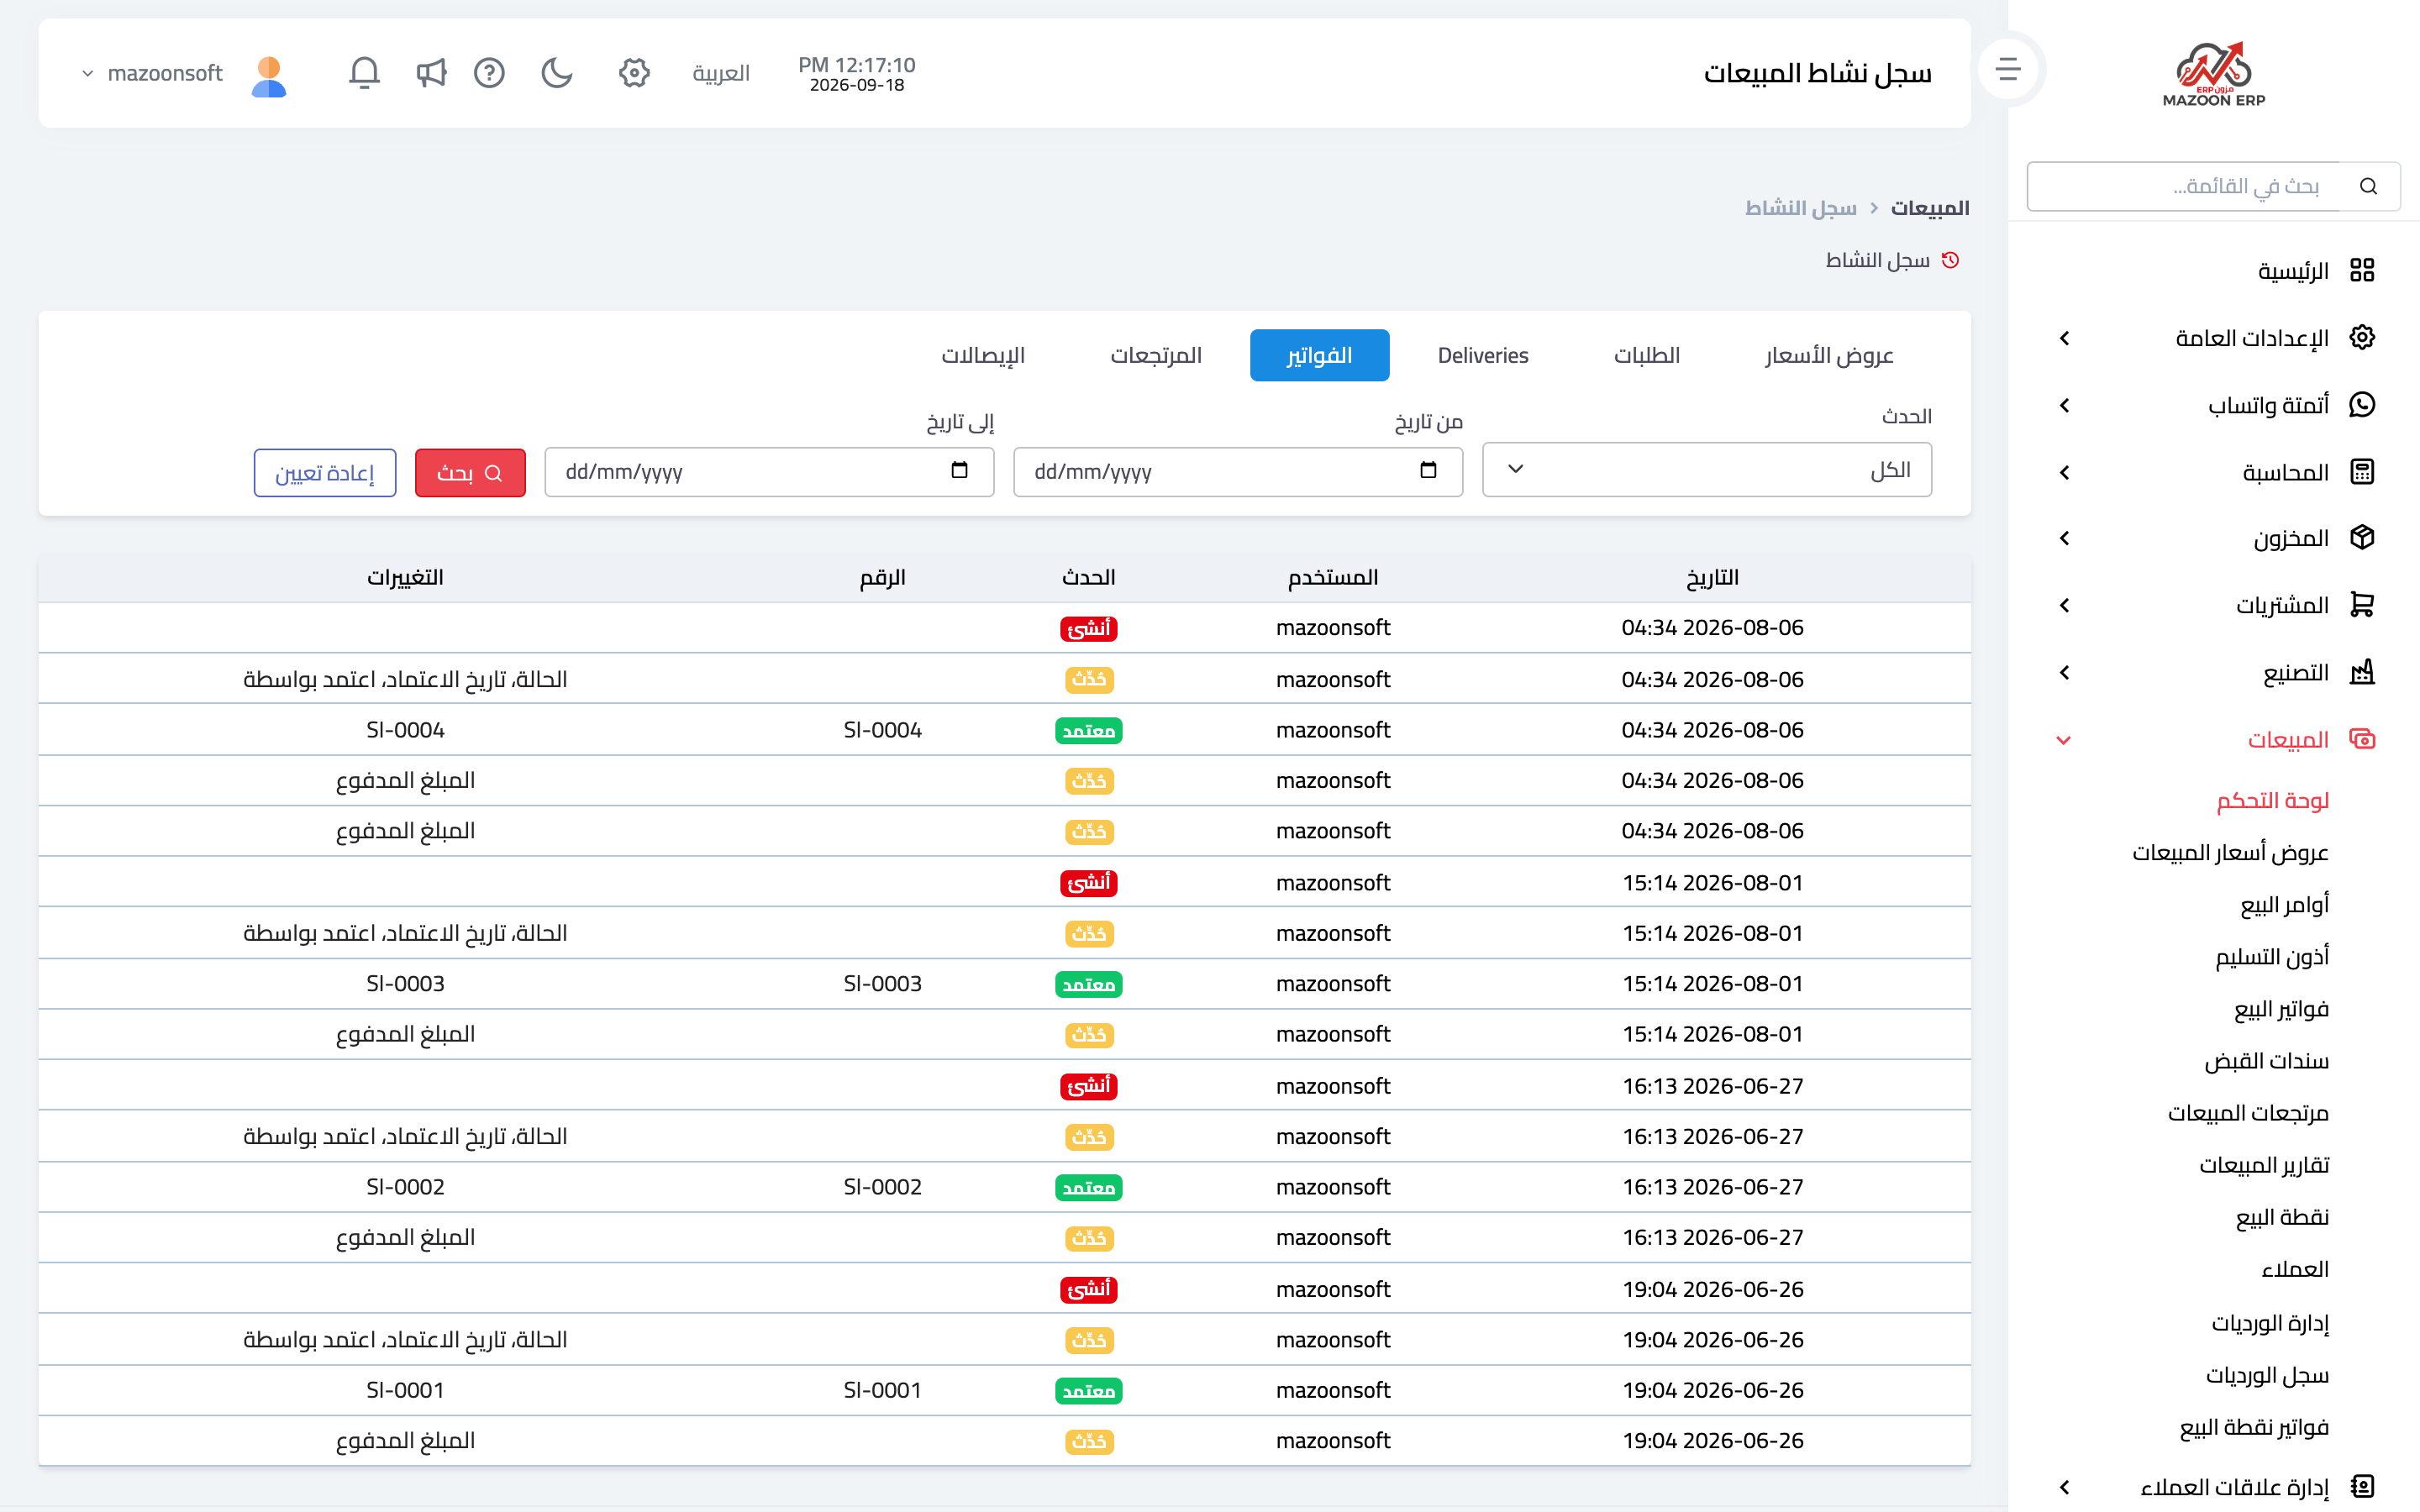
The Activity Log button at the top of the sales dashboard opens a log dedicated to sales documents — image 2: who created, edited, approved or cancelled what, and when.
It is the first place to look for questions like "who cancelled this invoice?" or "when did this line's price change?". The log is read-only: it cannot be edited or deleted — which is exactly what makes it a reliable reference.
A suggested routine
- Daily — review the day's sales and close POS shifts with a cash count.
- Weekly — review receivables and chase collection, and look at pending quotations.
- Monthly — read sales by item and by customer, compare with last month, and check the return rate.
For the full financial picture, read these alongside receivables aging and the income statement in the Accounting module.
Screenshots
Try what you just read on your own data
Open a free 7-day trial — no credit card, with your own company link in minutes.