
Sales reports: what each of the seven tabs is for
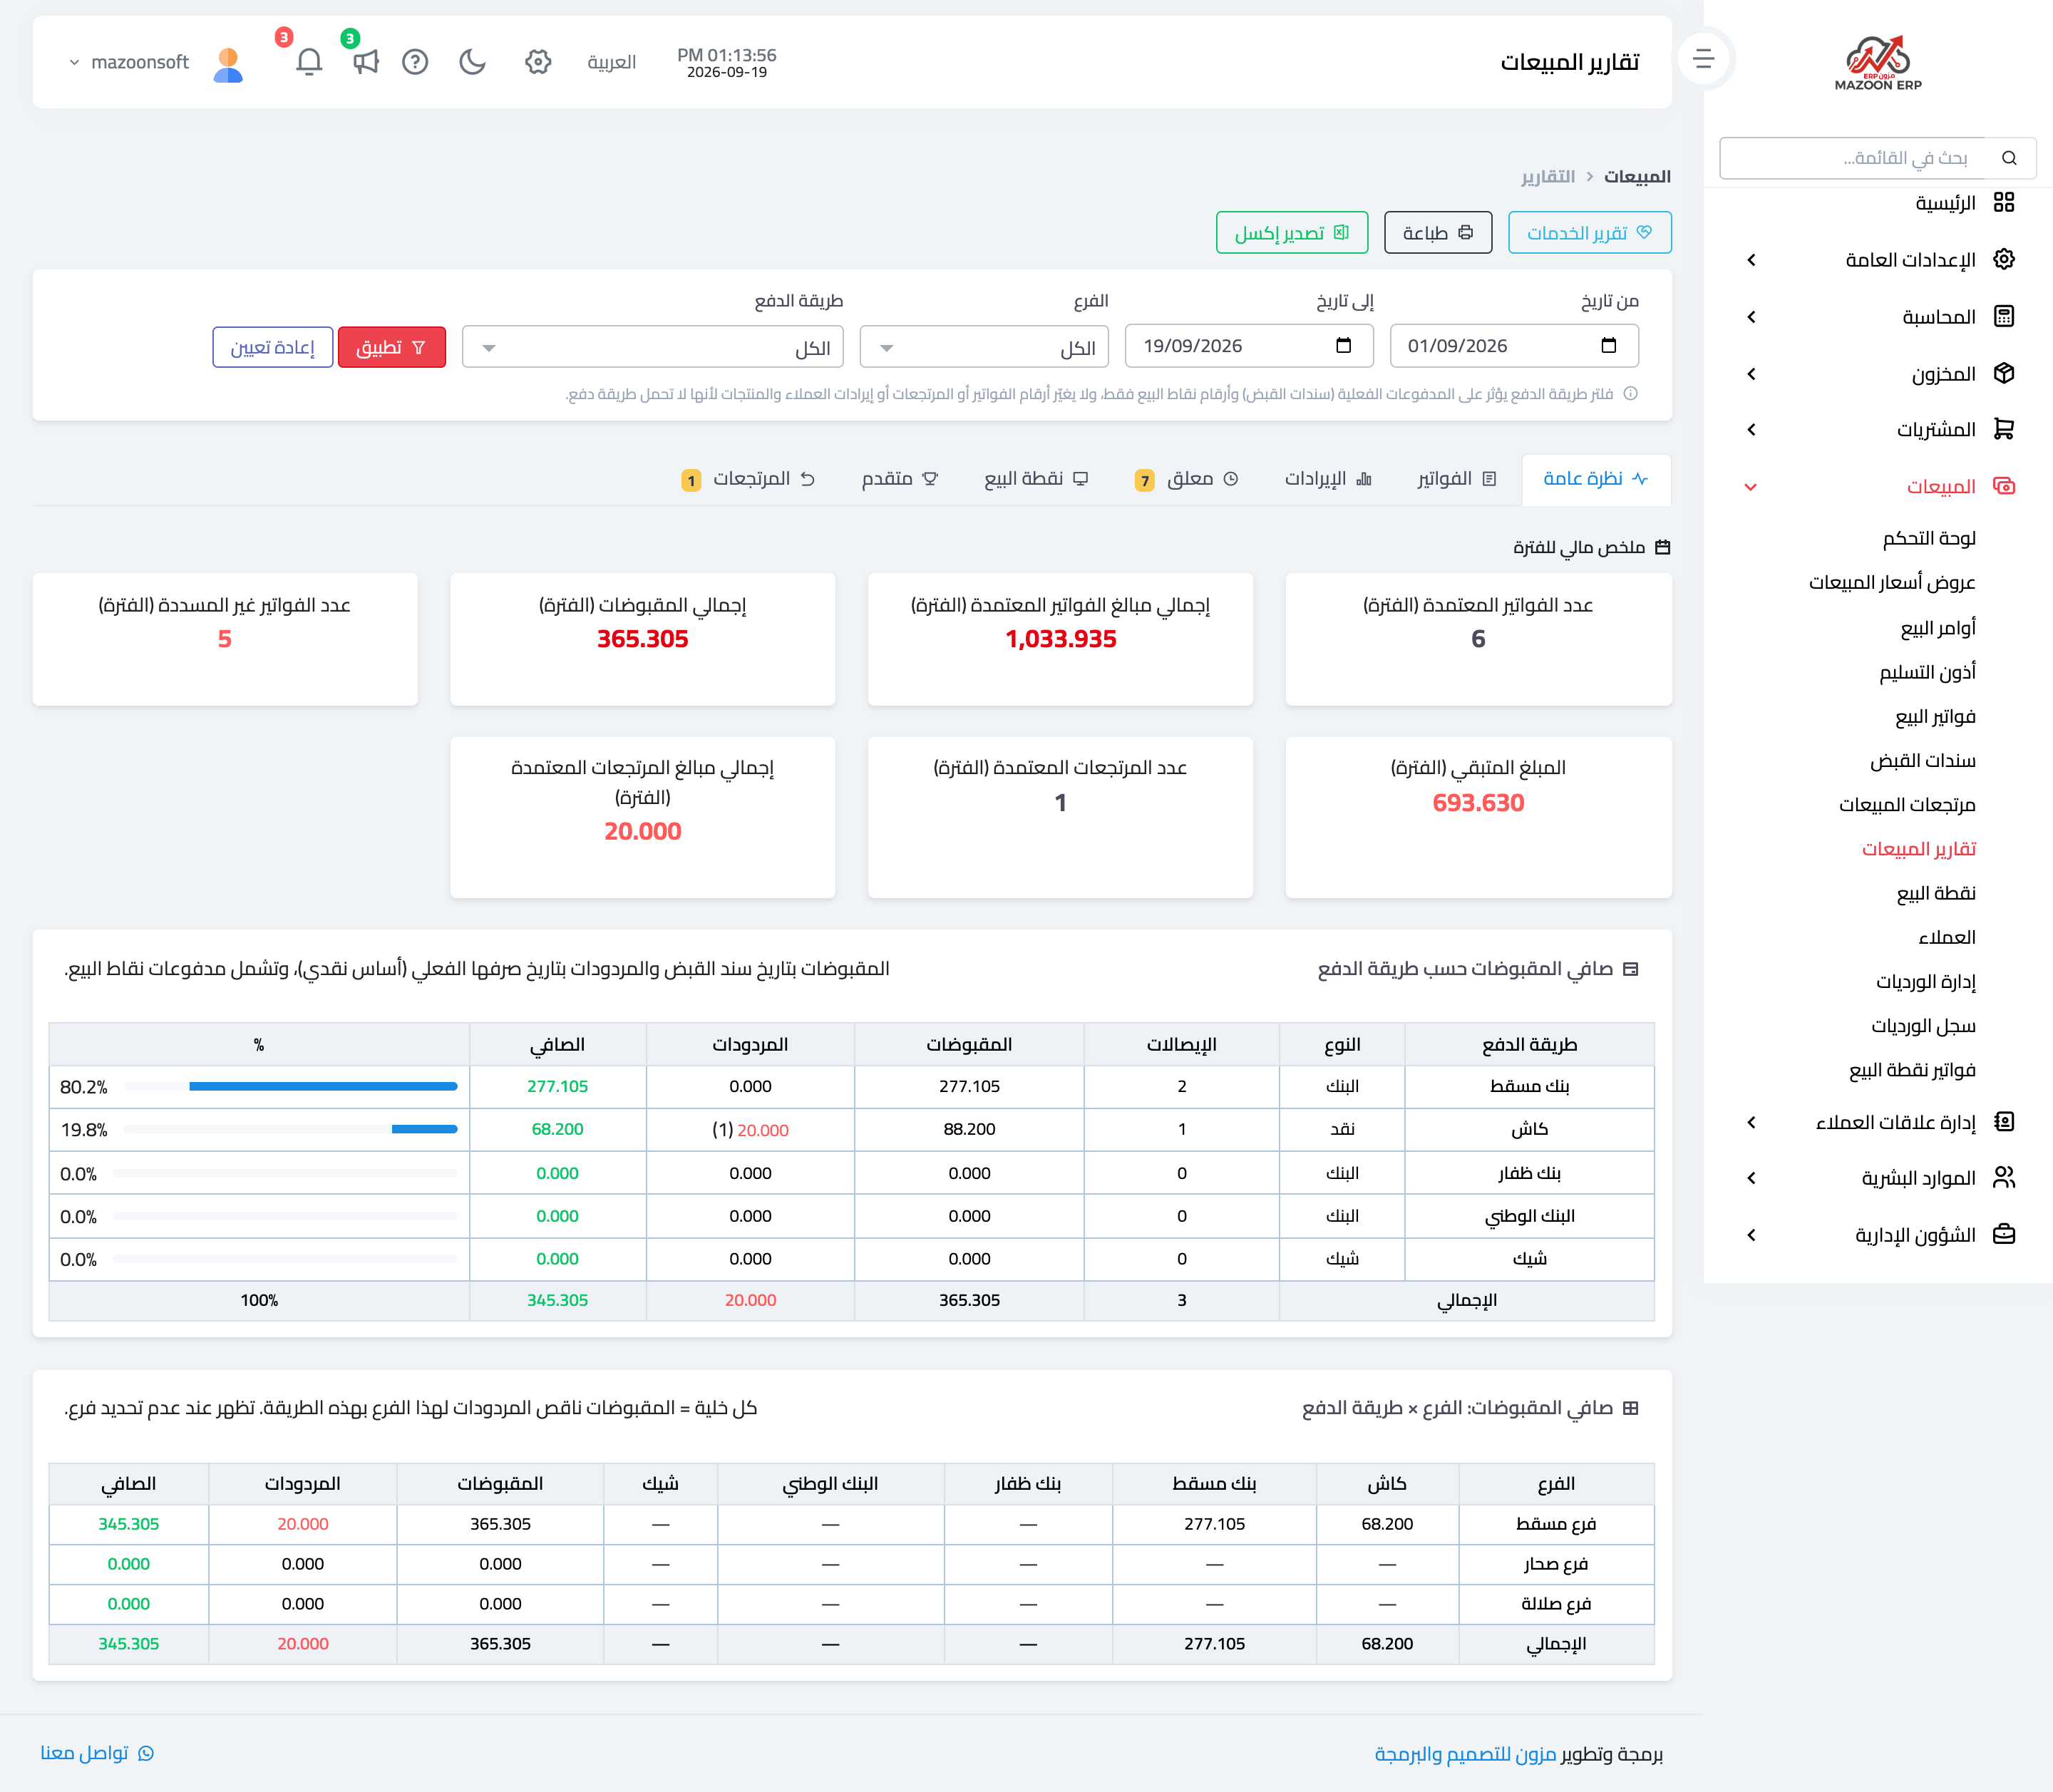
One screen, seven tabs, each answering a different question. The filters at the top — from, to, branch and payment method — apply to every tab — image 1.
1 — Overview
The period's financial summary: approved invoice count and total, total collections, remaining amount, unpaid invoice count, and the number and value of returns.
Below it, net collections by payment method: receipts, collections, refunds, net and share for each method. These are dated by the actual receipt date — a cash basis, so they deliberately do not match the invoice figures. Then a branch × payment method matrix when no branch is selected.
2 — Invoices
The period's invoices with number, date, customer, total, paid amount, balance and status, with POS invoices marked.
3 — Revenue
Revenue broken down by customer, plus recent deliveries. It tells you who makes up most of your sales.
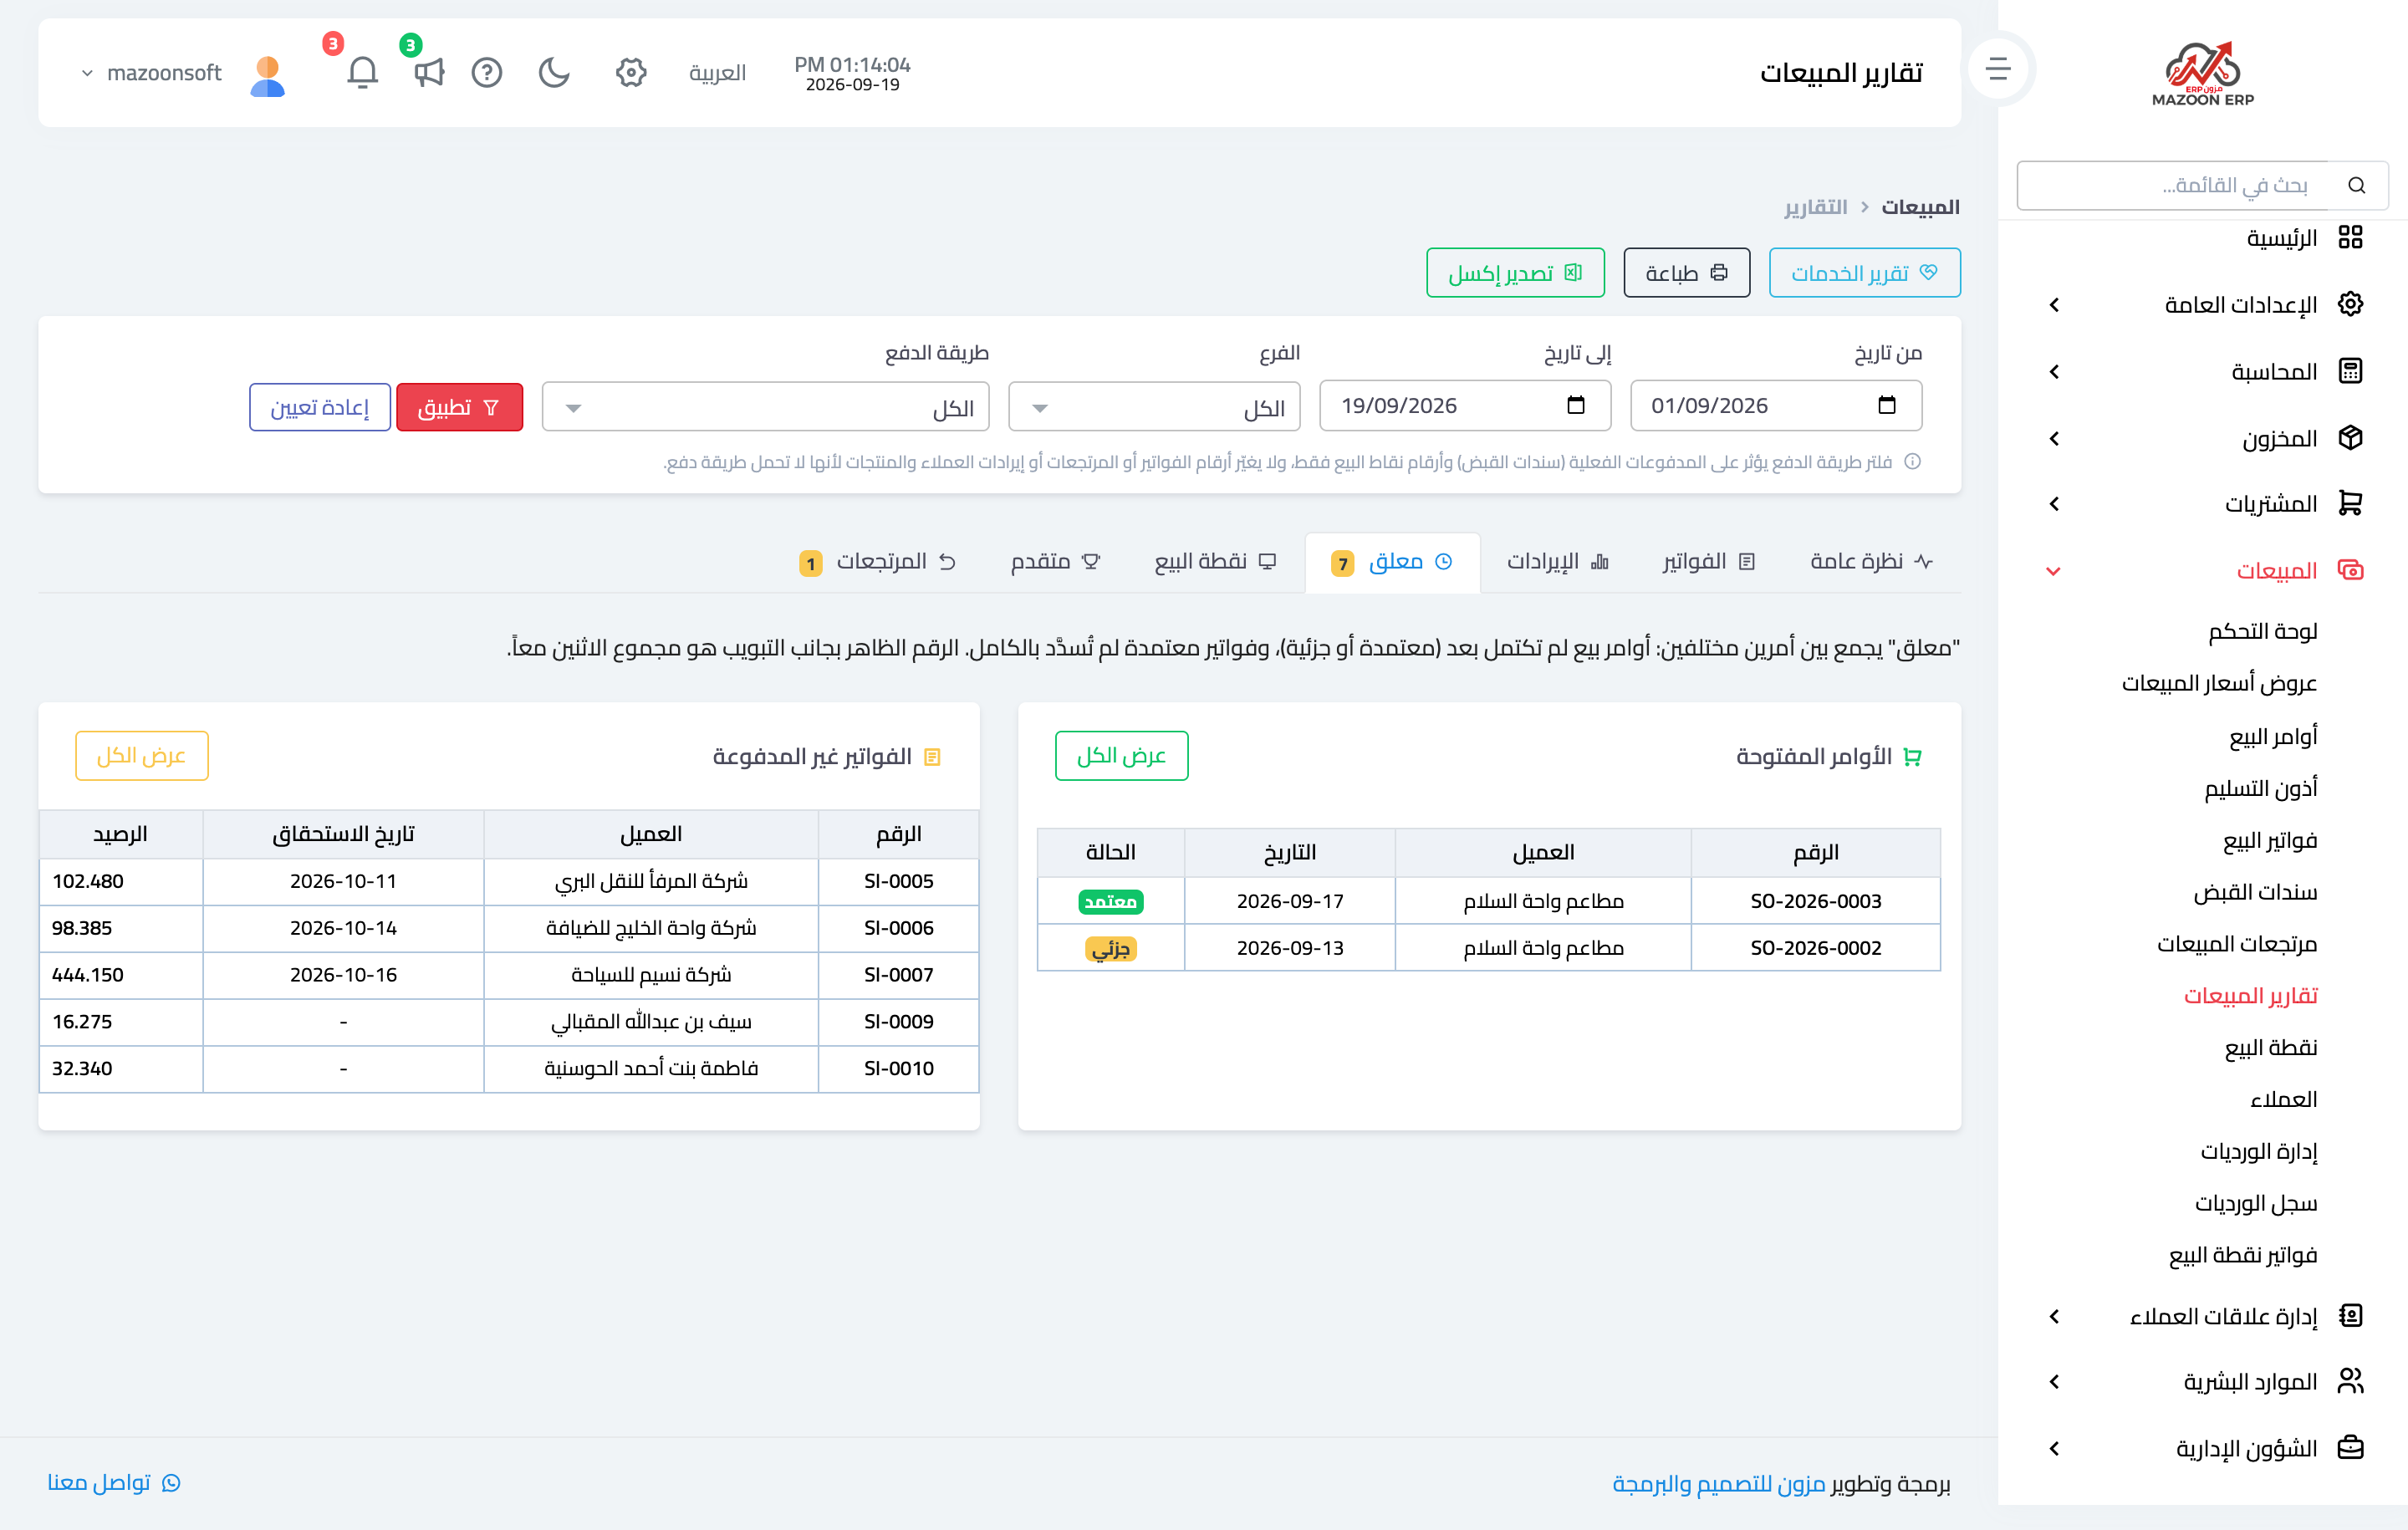
4 — Pending
What needs chasing: open orders and unpaid invoices with due dates and balances. A numeric badge on the tab tells you the count before you open it — start your day here — image 2.
5 — POS
Completed transactions in the period and their breakdown per terminal, so you can compare tills.
6 — Advanced
Top products by quantity and revenue, and revenue by branch.
7 — Returns
Total, approved and pending returns, and the most returned products. A badge counts the drafts waiting for approval.
Notes
- The payment-method filter affects the payments and POS figures only, and does not change invoice, return or customer-revenue numbers — those carry no payment method at all. The screen says so under the filters.
- The Print and Export Excel buttons follow the filters applied.
- A user restricted to a branch sees only that branch's figures.
- Do not compare "total invoiced" with "total collected" directly; the first is accrual and the second is cash, and the gap is your receivables.
Screenshots
Try what you just read on your own data
Open a free 7-day trial — no credit card, with your own company link in minutes.