
How do I see fleet utilisation and which vehicle is profitable?
The question that settles whether to buy another vehicle or sell an old one is not “how much did we take?” but “how many days was each vehicle actually rented?”
The reports
- Open Vehicle Rental → Reports — Figure 1 — for period revenue, revenue by month, the most rented vehicles and completed contracts.
- The utilisation report — Figure 2 — shows per vehicle: rentals count, rented days, occupancy rate, revenue, maintenance and the net.
- The aging report — Figure 3 — groups what customers owe by how many days have passed since the expected return date; the longer the delay, the higher the risk of non-collection.
- Set the period and branch in the filters, then print or export the result.
How to read the numbers
- Low occupancy, high revenue — a luxury vehicle working rarely at a high price. That is fine.
- Low occupancy, low revenue — a dead vehicle; review its price, its photos and whether it is visible on the website.
- Good revenue, high maintenance — the net is the verdict, and it may be time to sell.
Notes
- These reports are only as accurate as your contract closures; old contracts left open inflate occupancy falsely.
- Log maintenance costs as they happen, otherwise the net in the report is just revenue.
- Compare a period against the same period last year rather than last month; rentals are seasonal by nature.
Screenshots
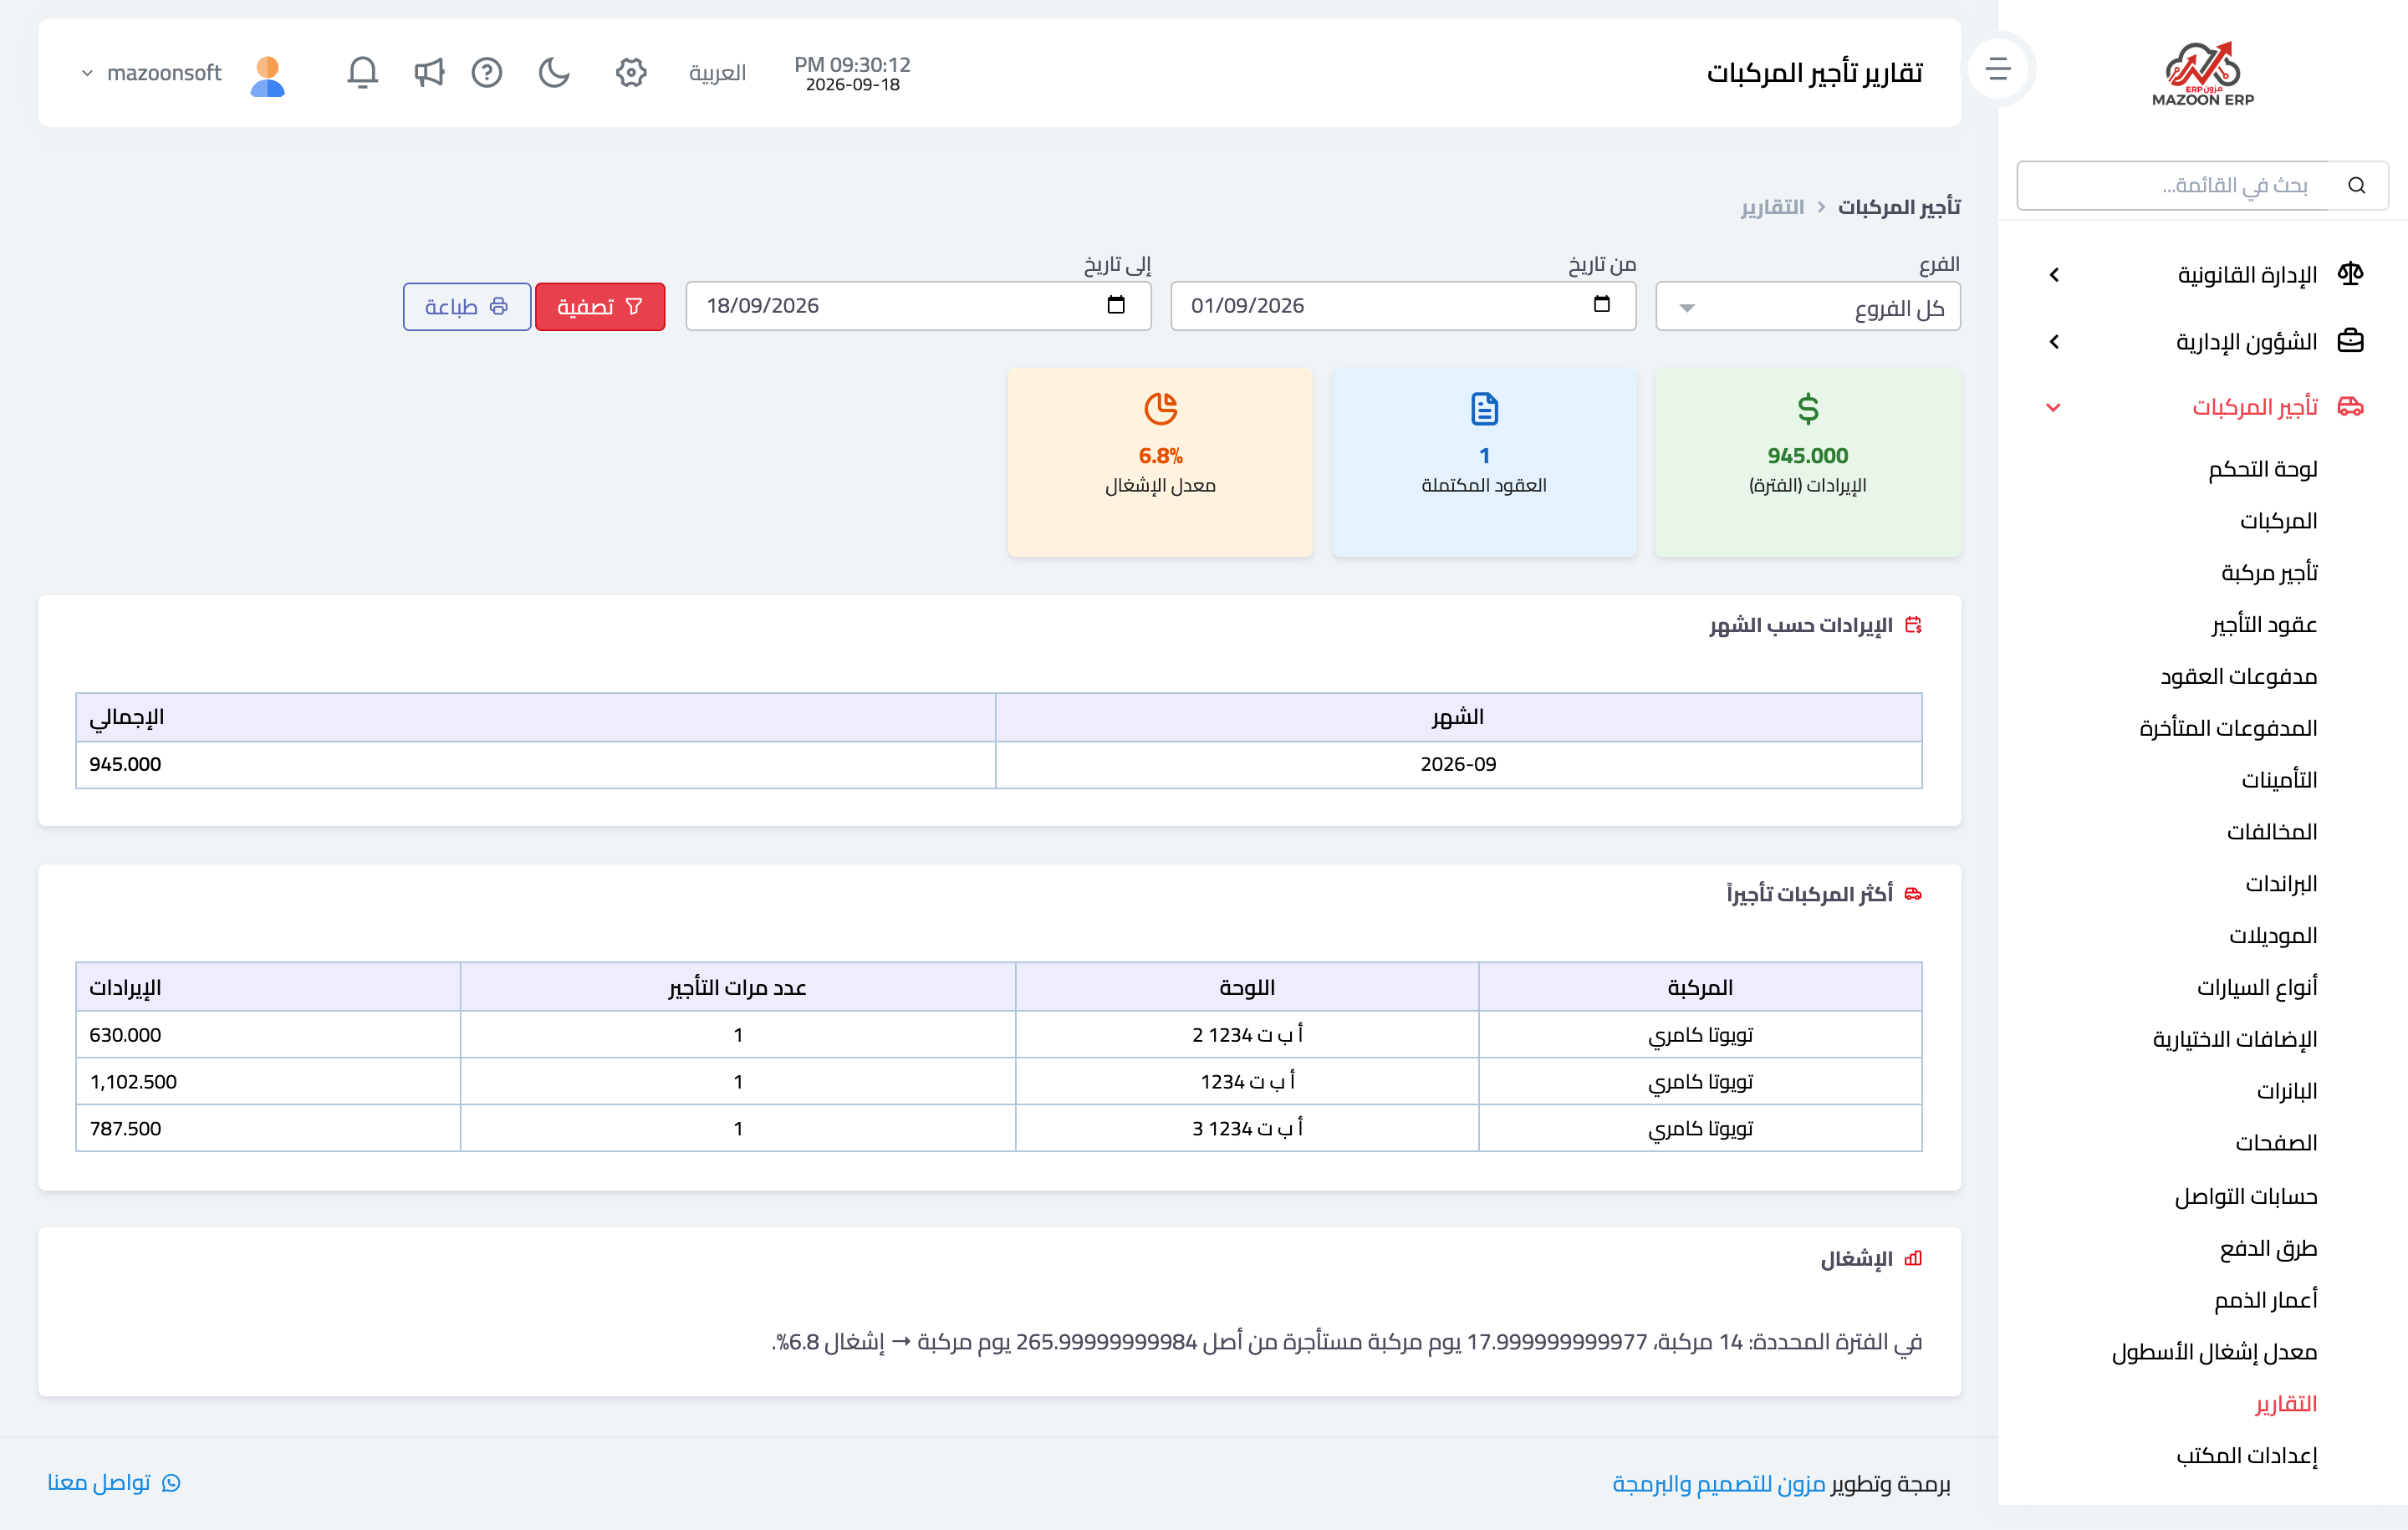
Figure 1
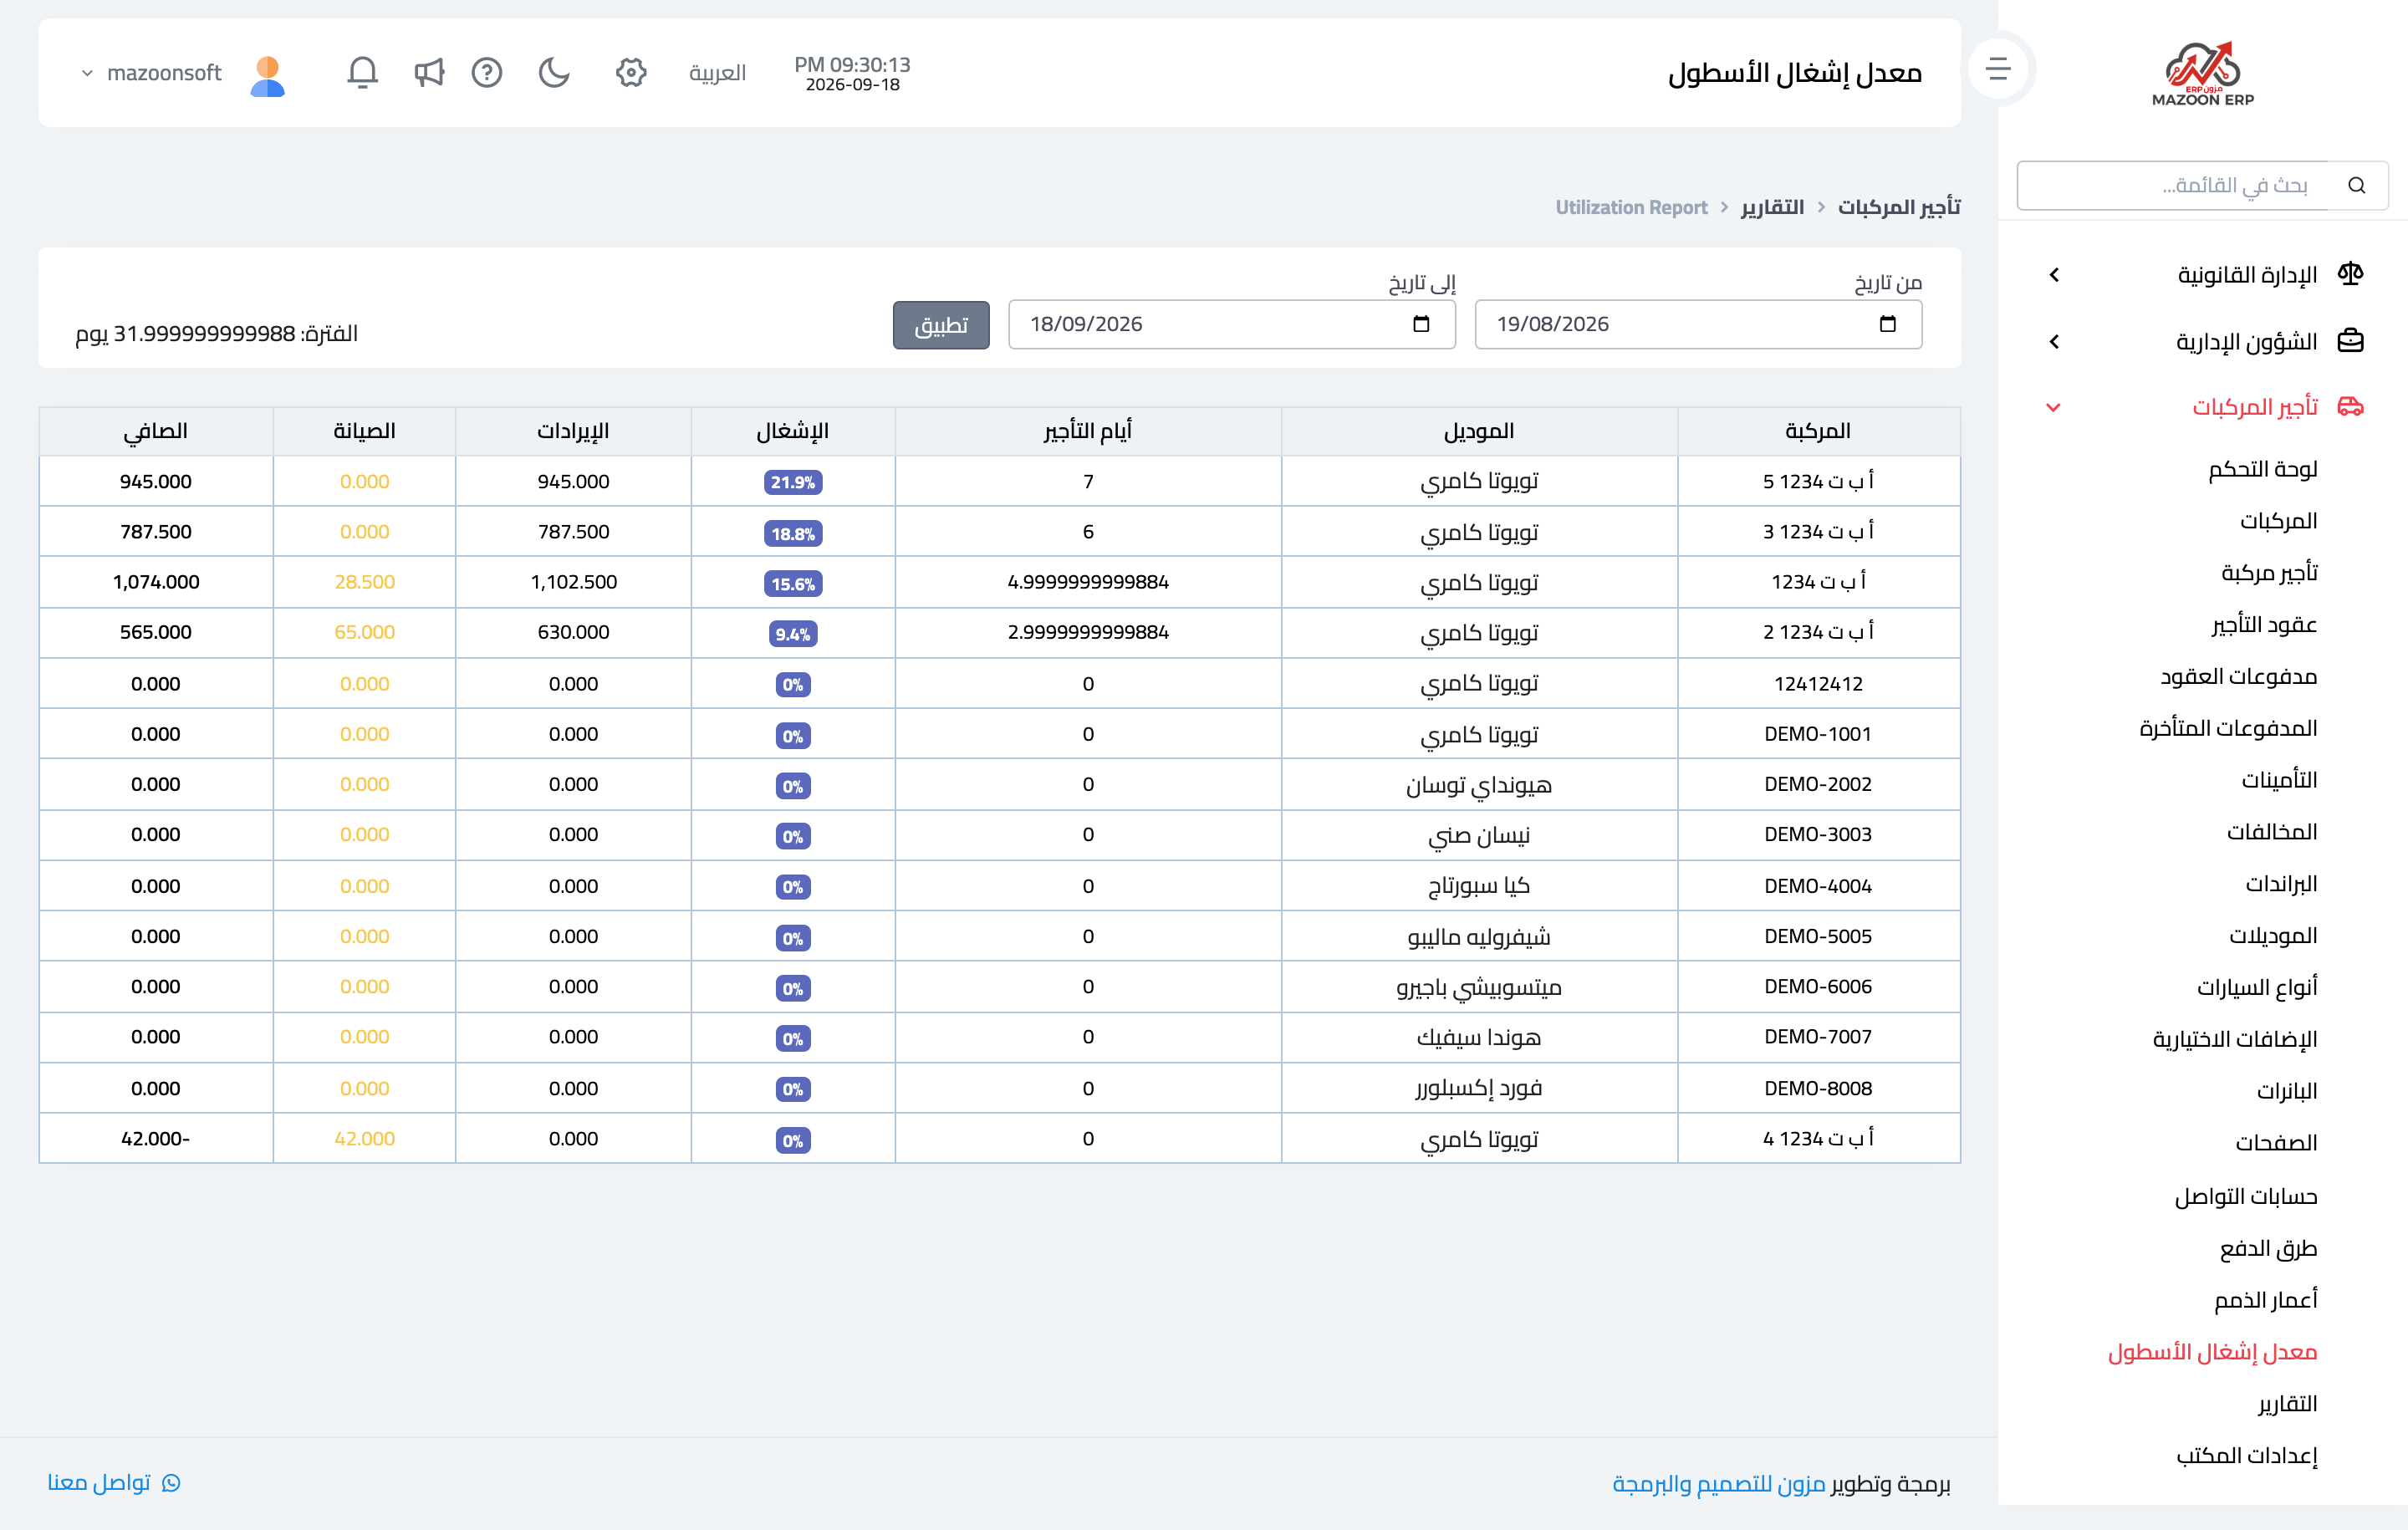
Figure 2
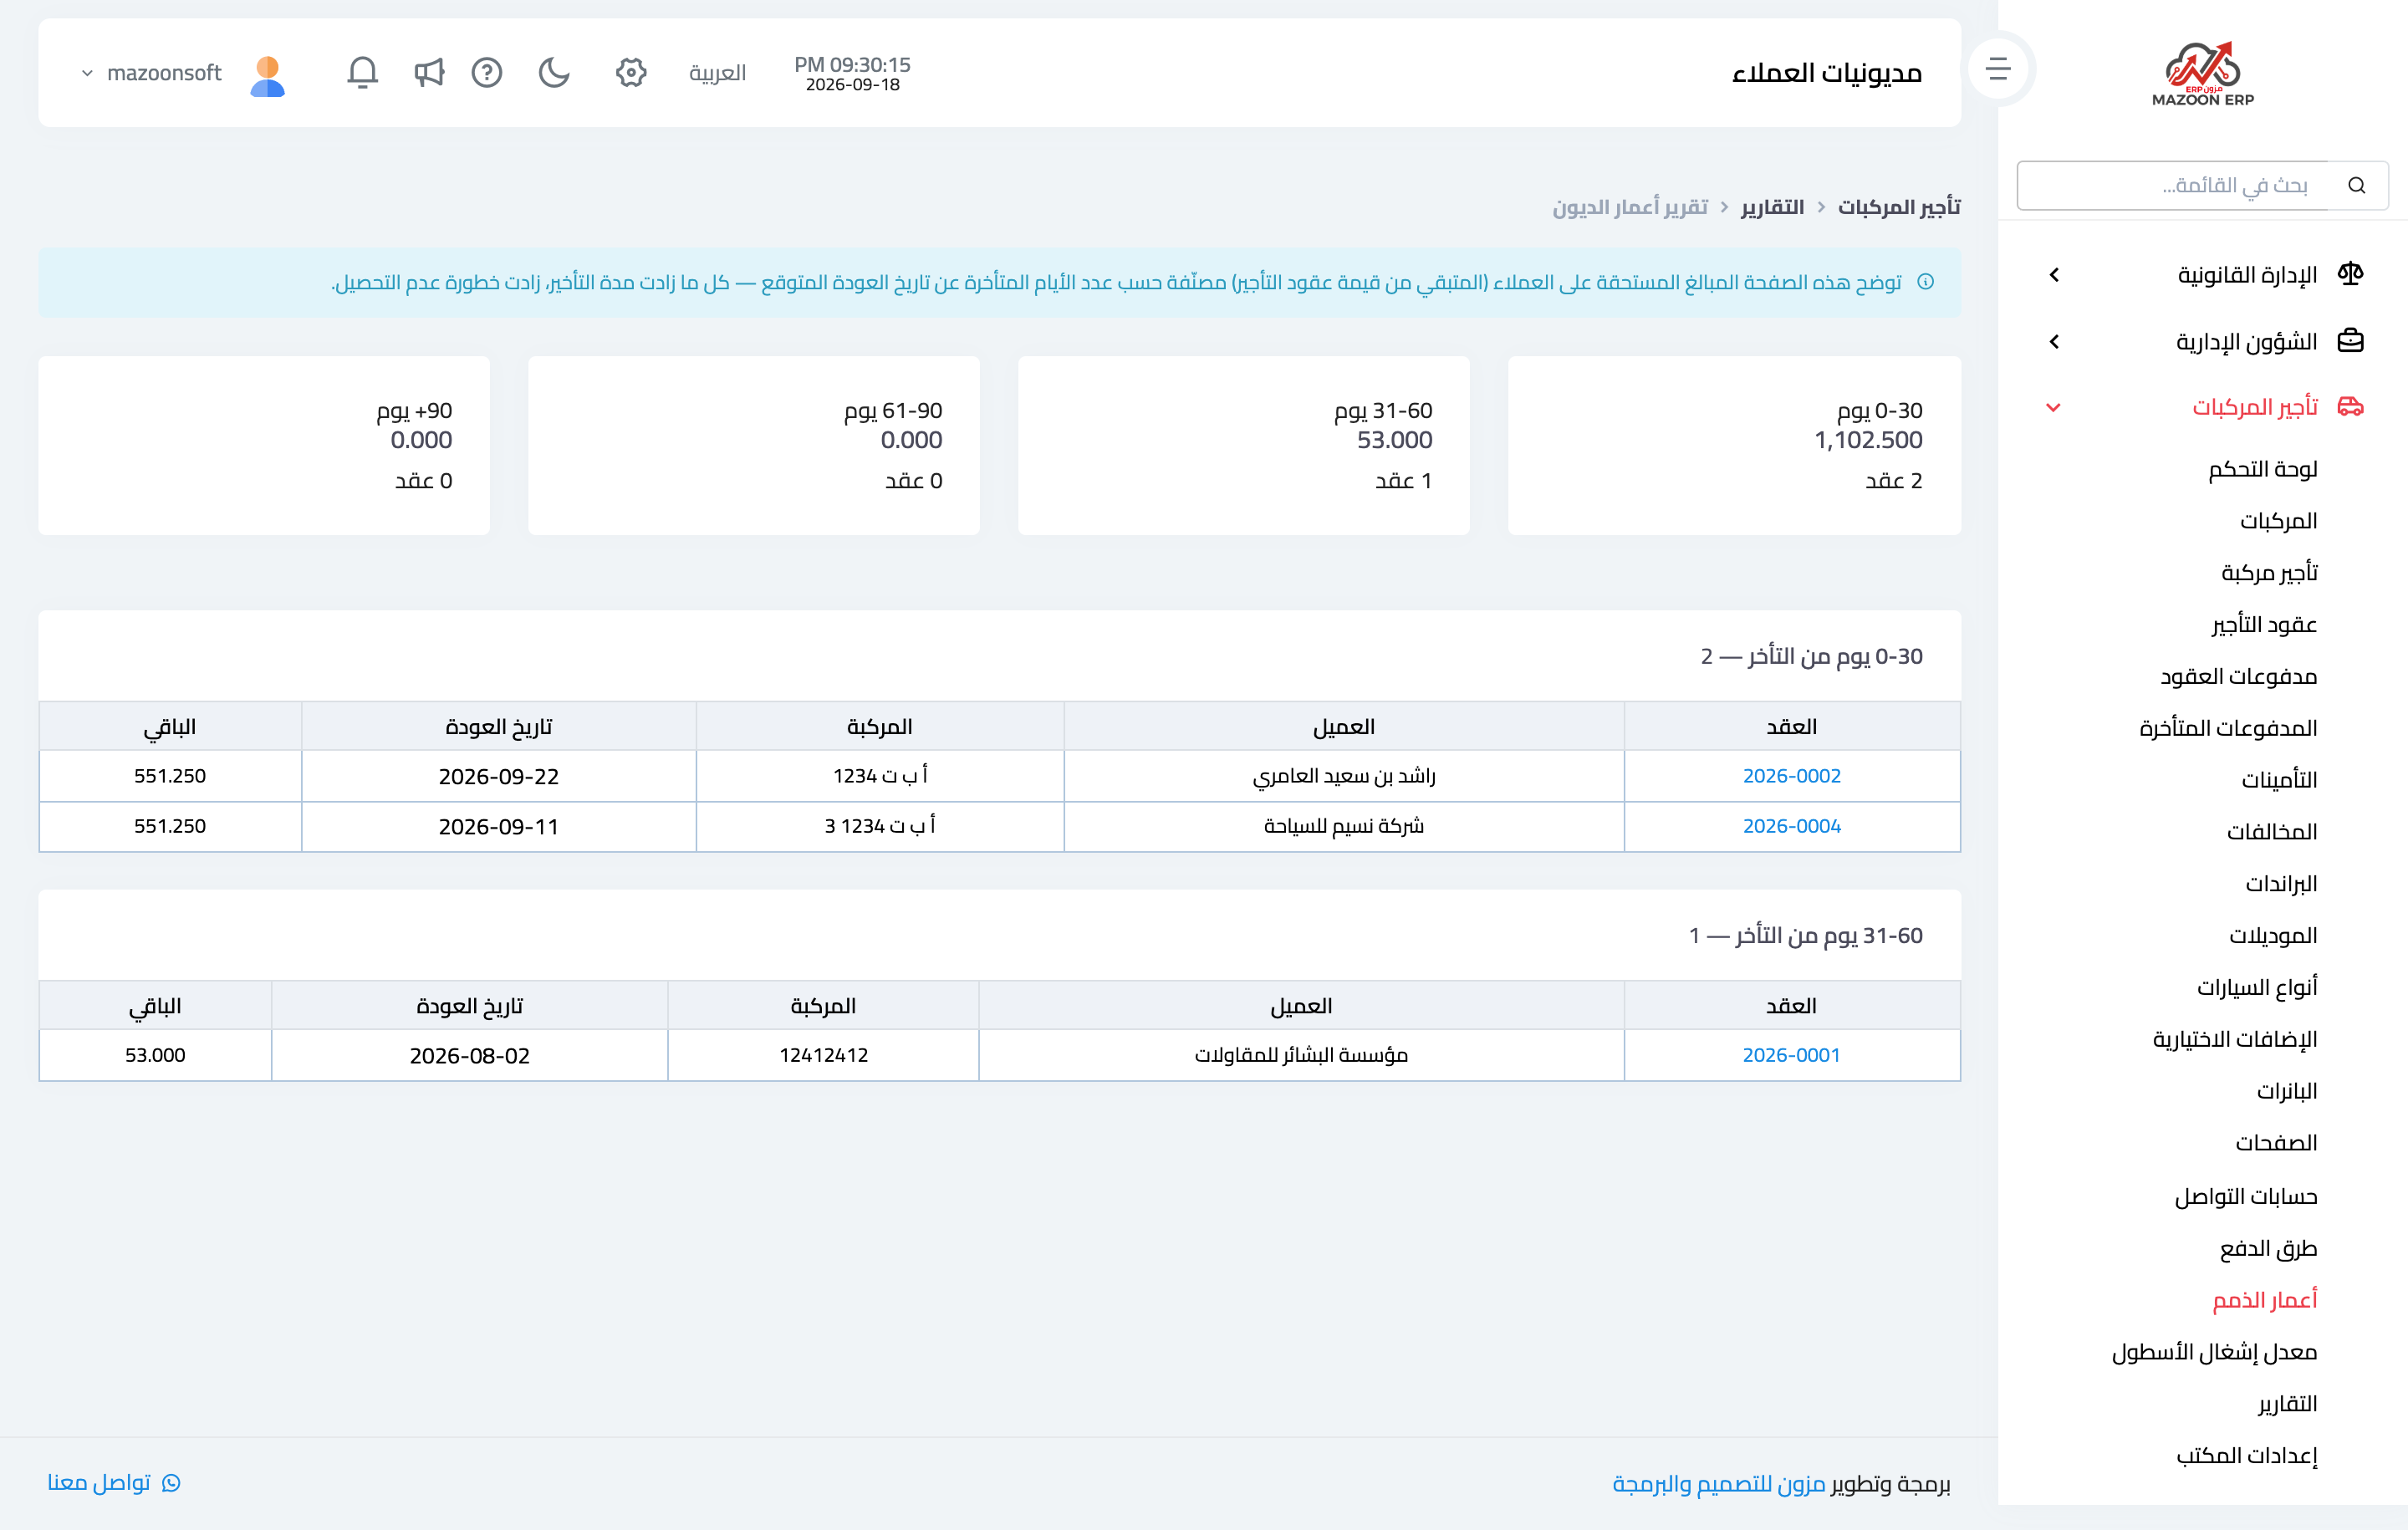
Figure 3
Try what you just read on your own data
Open a free 7-day trial — no credit card, with your own company link in minutes.