
How do I read the farm reports?
Four reports that answer the questions a farm owner actually asks.
The reports
- Open Farm Management → Reports — Figure 1.
- Farm profitability — Figure 2 — sets each farm’s revenue against its costs (feed, wages, inputs and veterinary).
- Production volume — Figure 3 — brings milk, eggs, dates and fruit together over the period.
- Mortality trend — Figure 4 — shows how mortality moves over time, the fastest warning signal on a farm.
- There is also branch profitability if you run more than one branch.
- Every report filters by period and farm and exports to a spreadsheet.
Notes
- The profitability report is only honest if feed and wages are recorded as they happen; a farm with no costs looks like gold.
- Compare a cycle with a comparable cycle rather than month against month; seasons differ a great deal.
- The mortality trend is the first thing to open when you sense something is wrong.
Screenshots
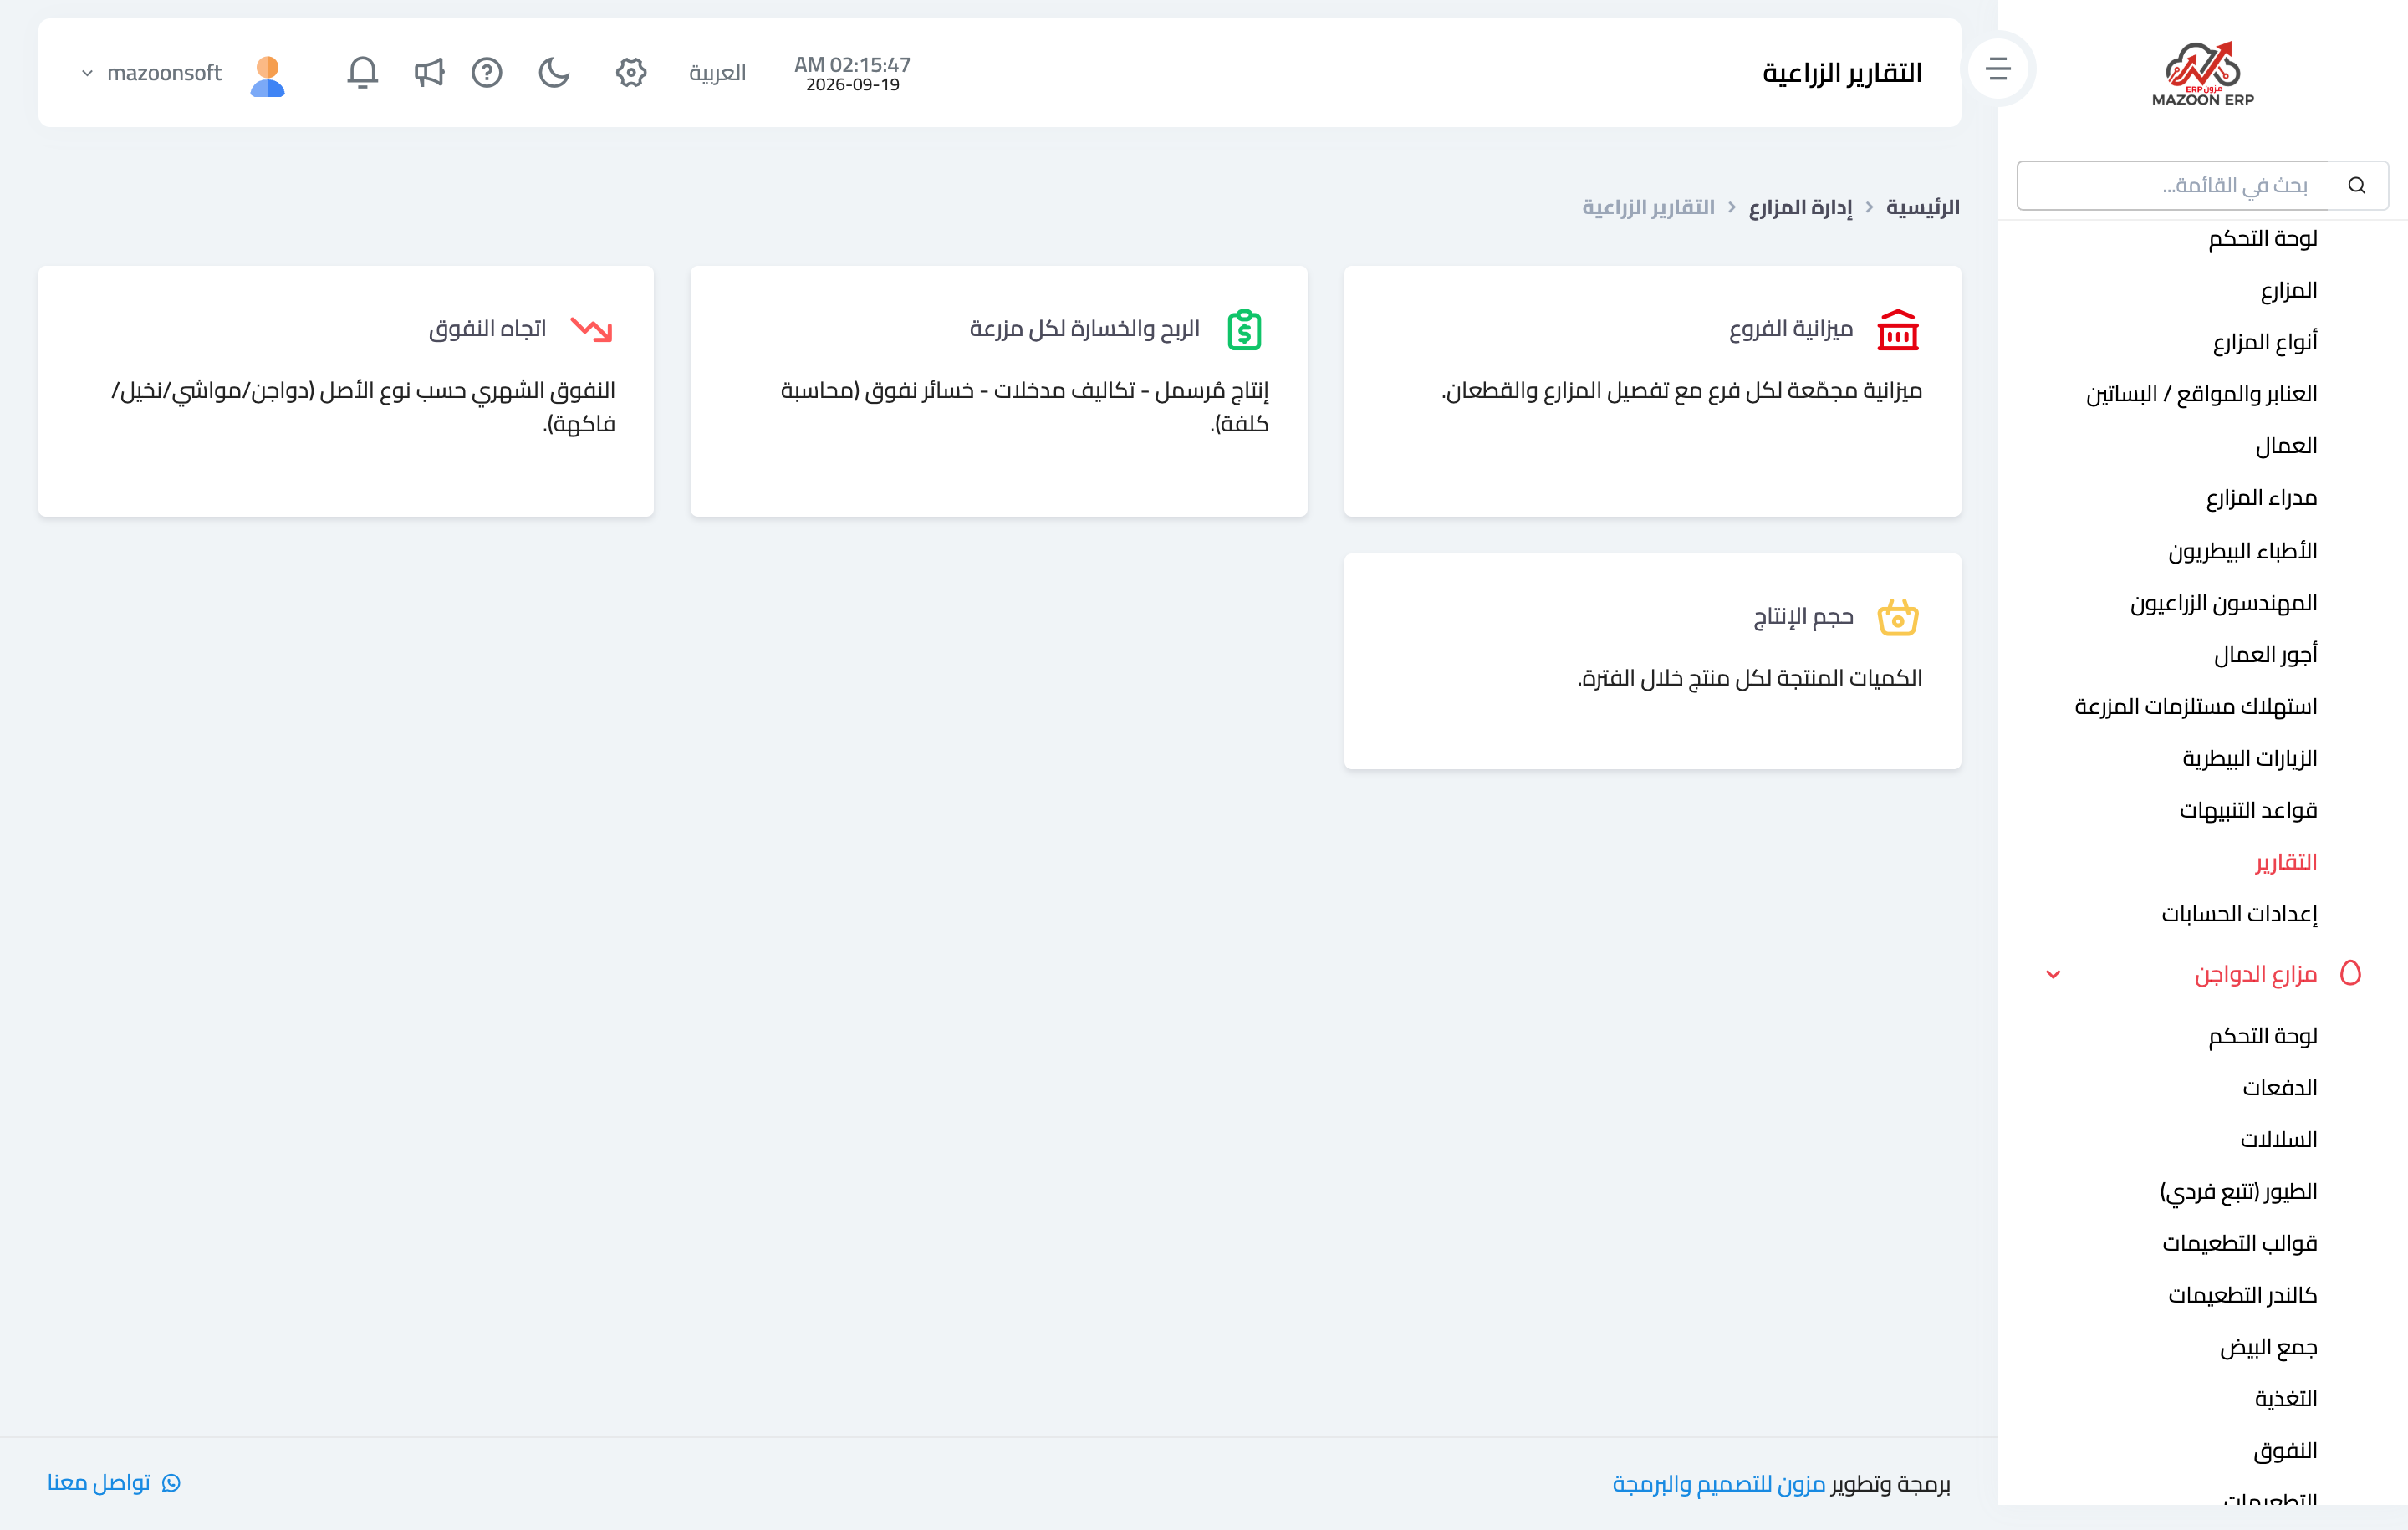
Figure 1
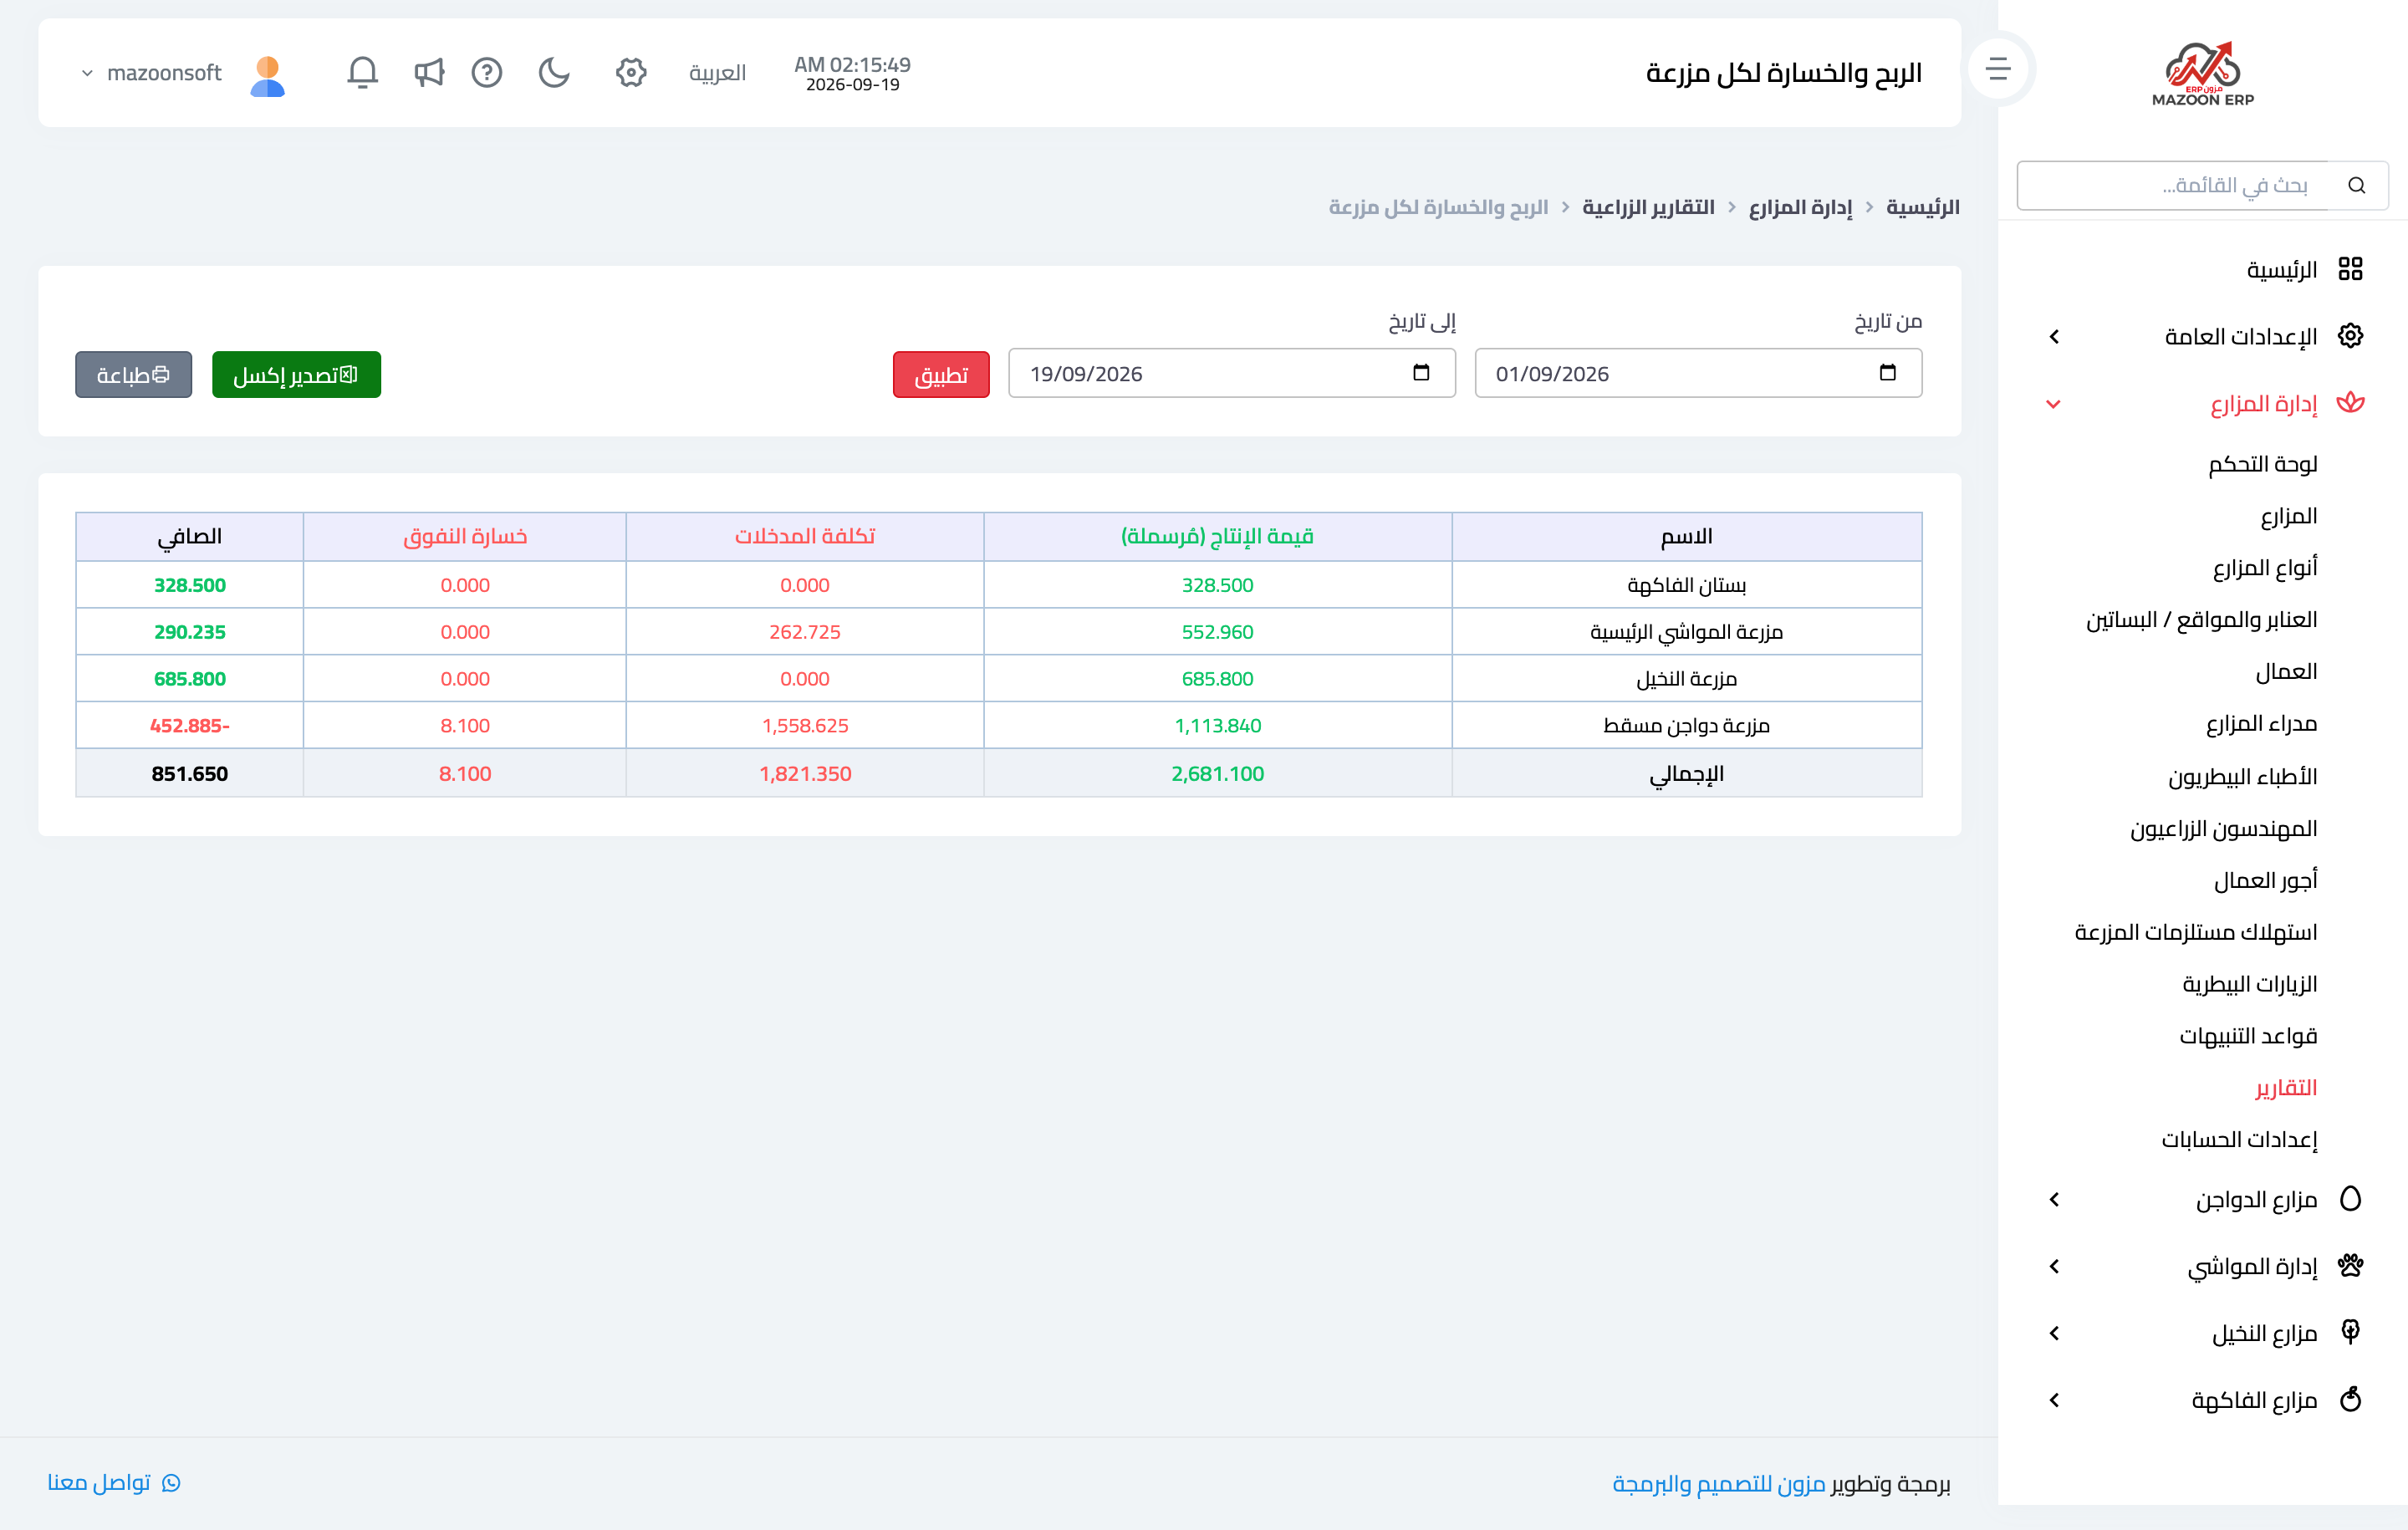
Figure 2
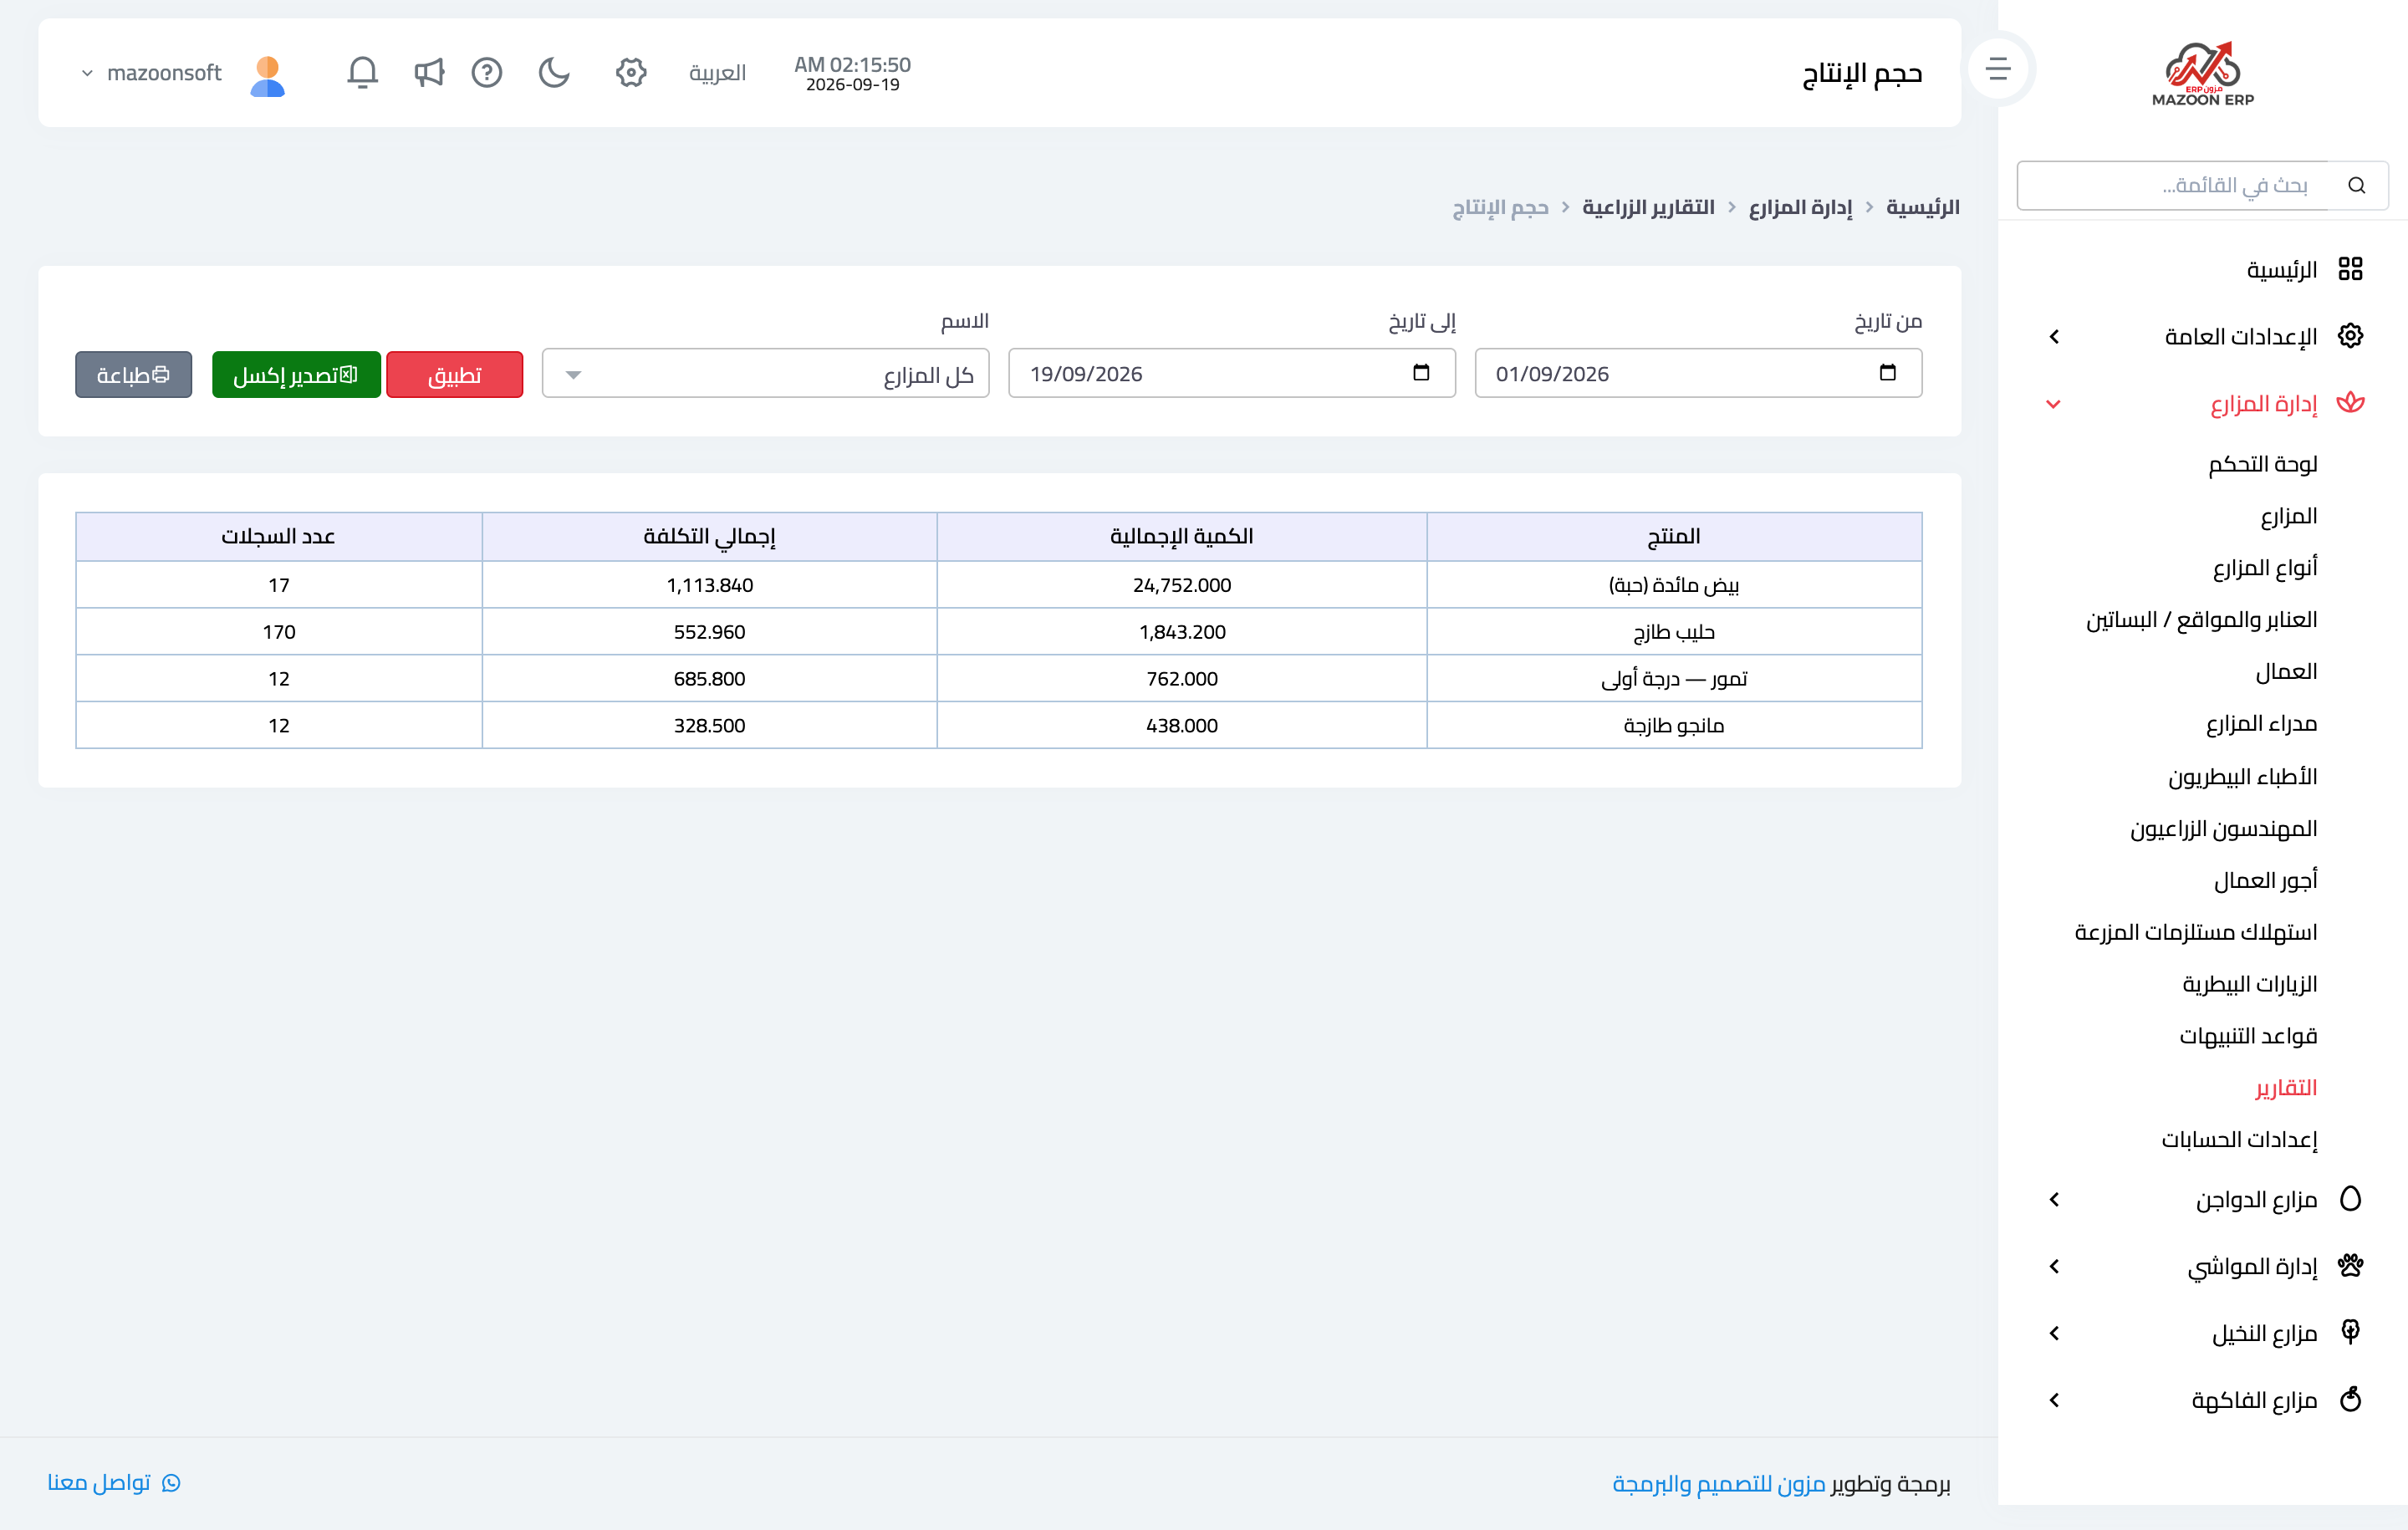
Figure 3
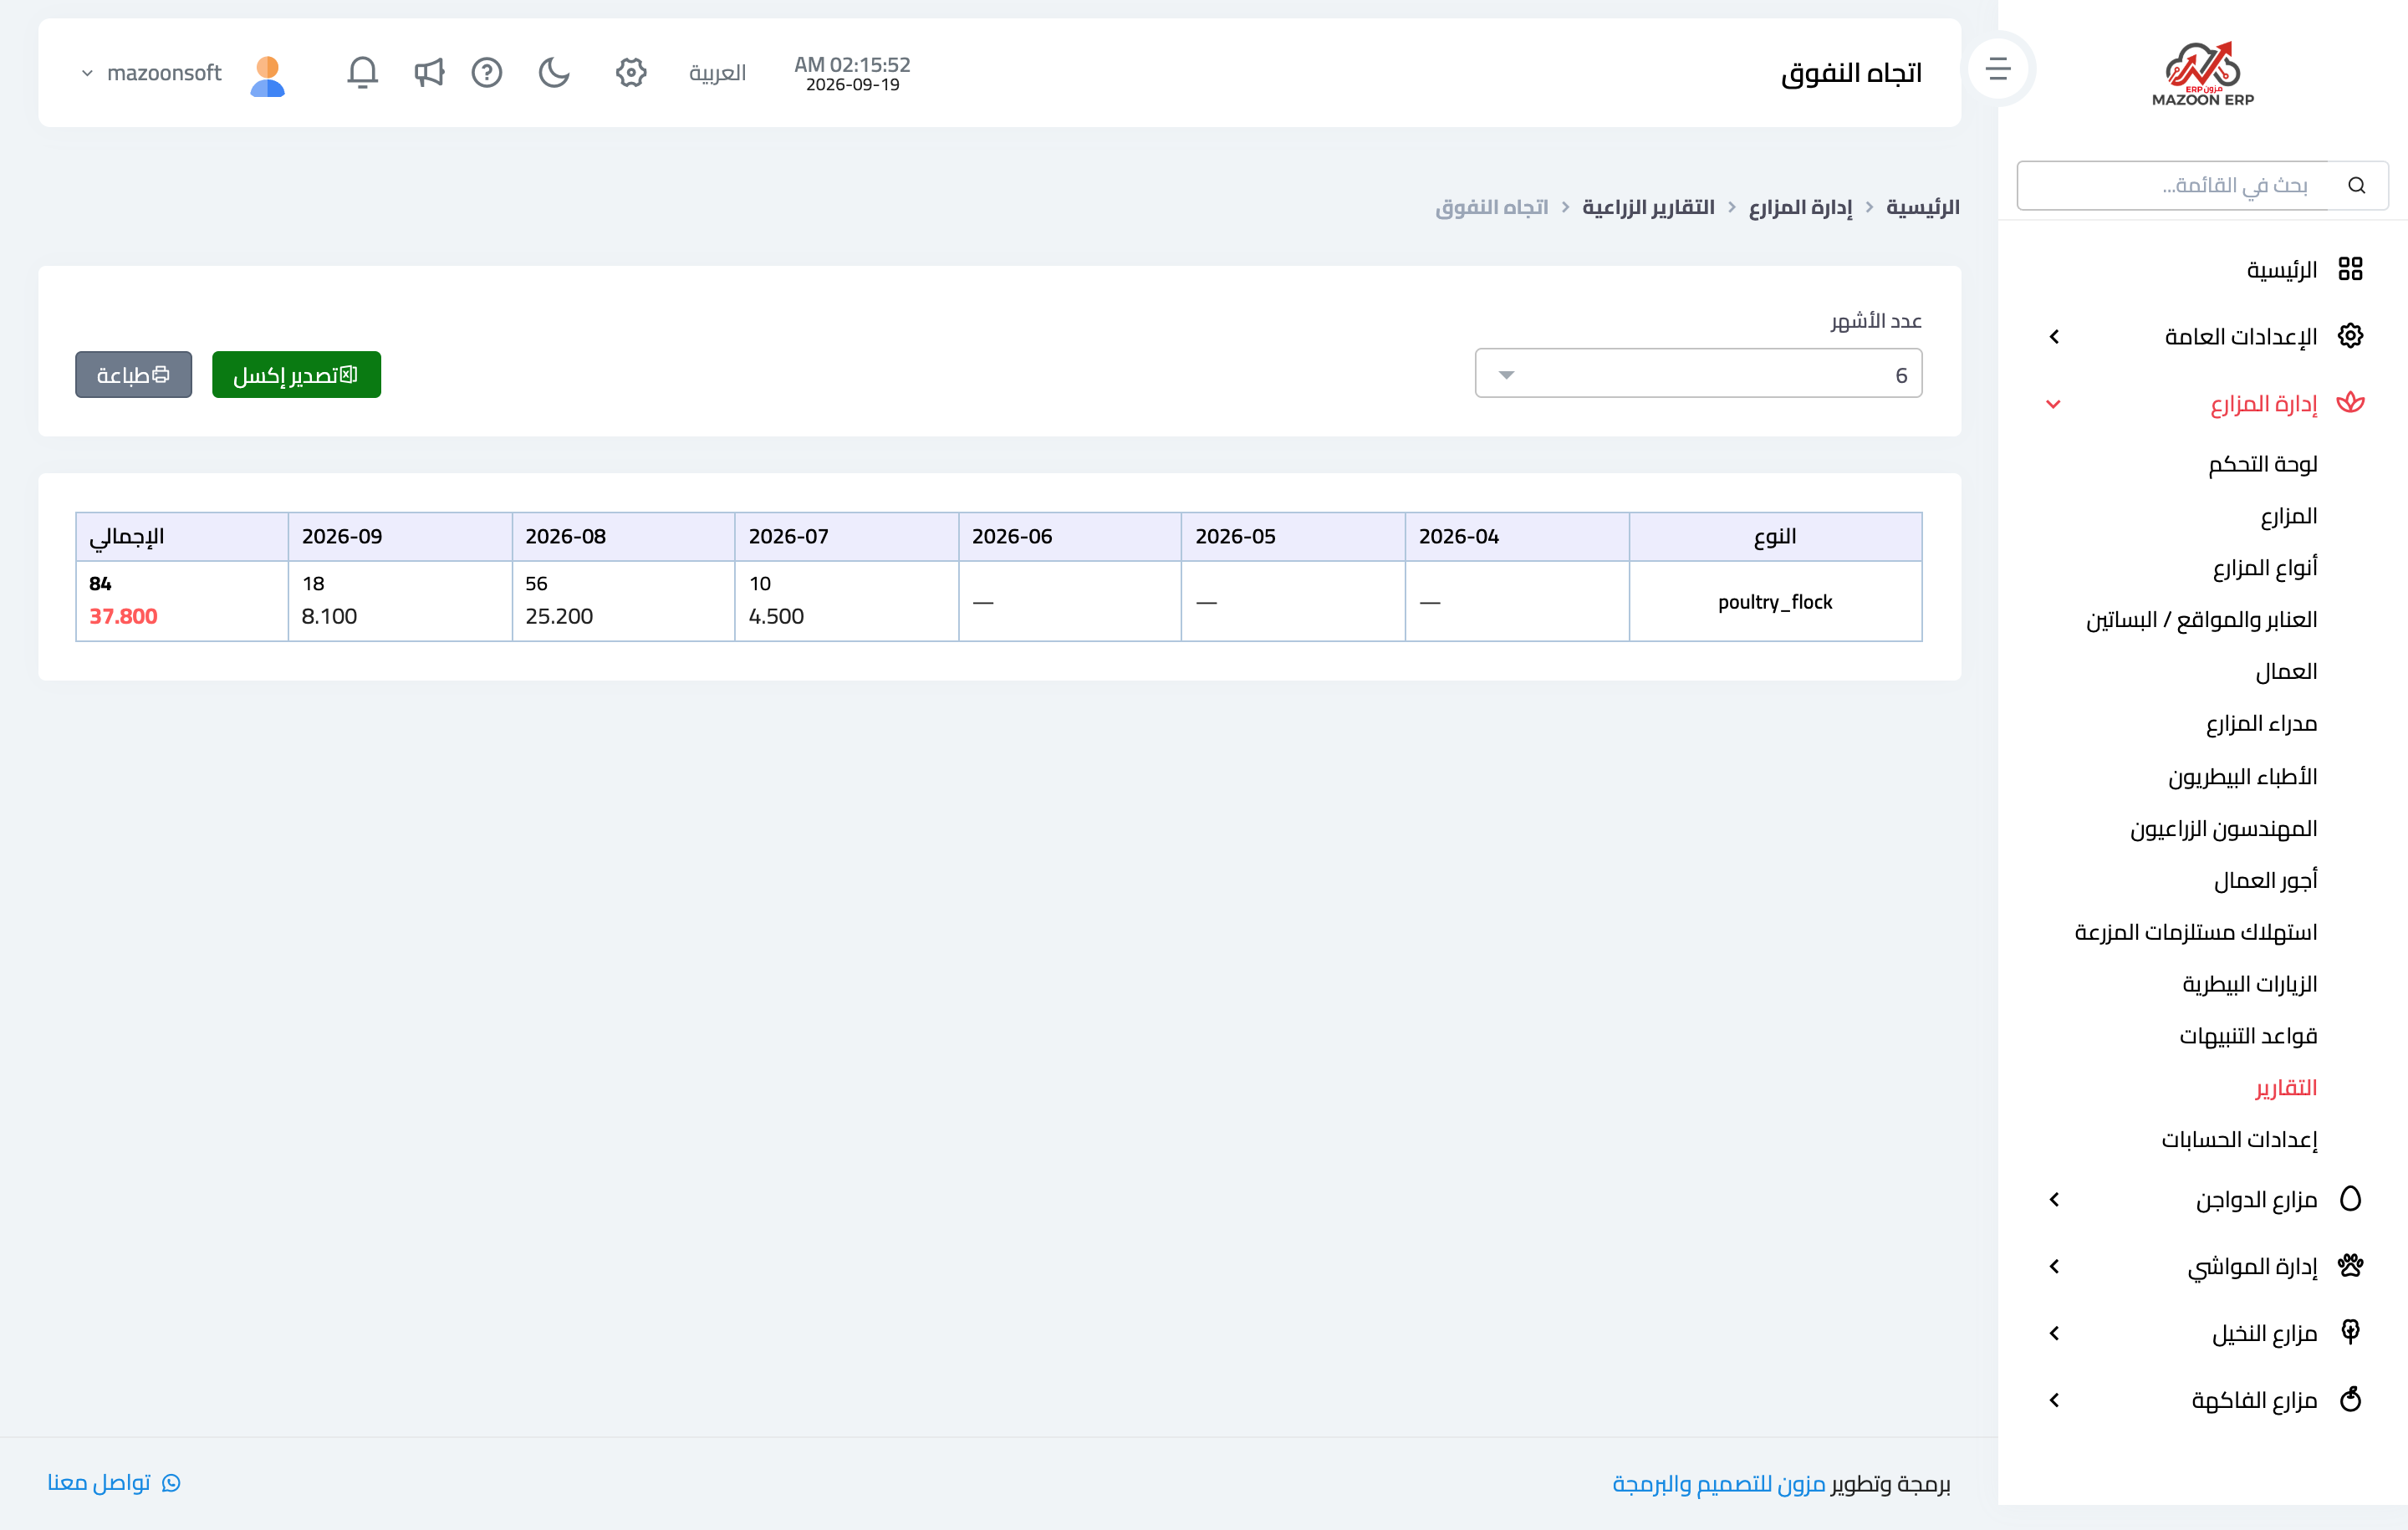
Figure 4
Try what you just read on your own data
Open a free 7-day trial — no credit card, with your own company link in minutes.