
Farm reports: profitability, output, and mortality
Everything you recorded in the specialised modules comes together in three reports answering three questions: which farm earns? how much did it produce? and is mortality rising?
Profit and loss per farm
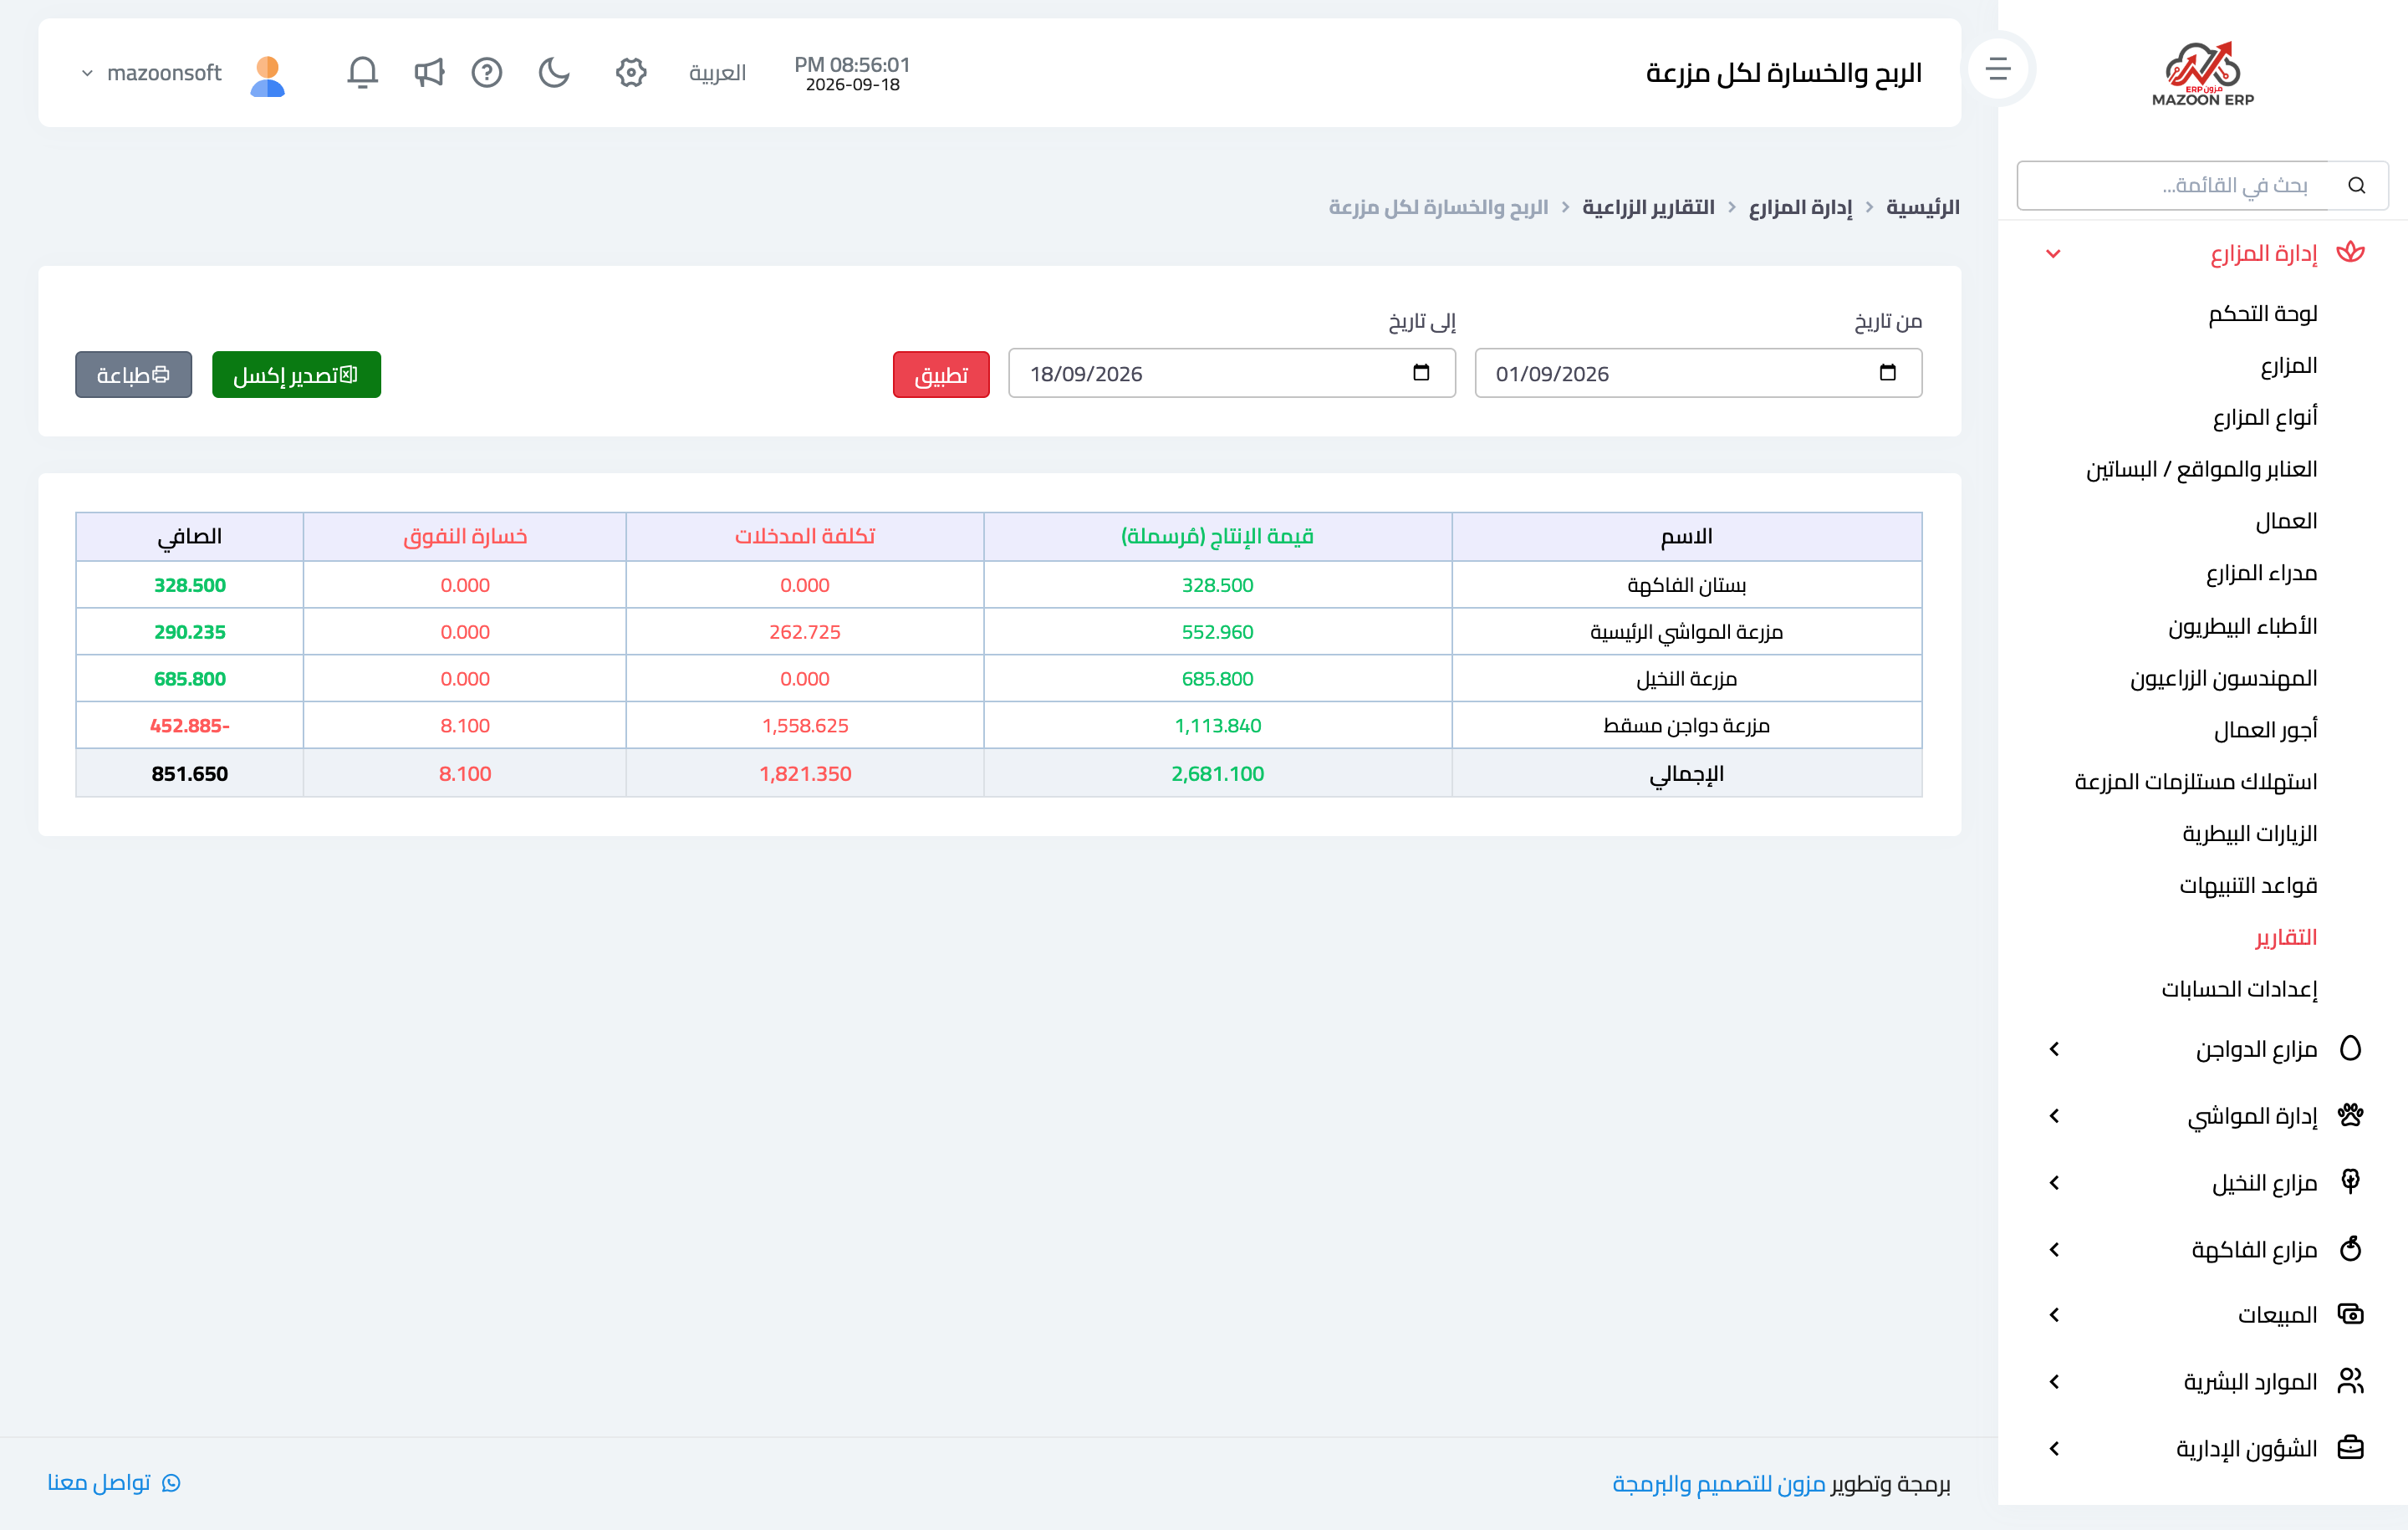
This is the most important report in the module — Figure 1 — putting all your farms in one table over a period you choose, in four columns:
- Production value — the eggs, milk, dates, and fruit that entered stock, valued at their price.
- Input cost — the feed, medicine, and fertiliser issued from the store to the farm.
- Mortality loss — the book value of the birds, animals, and trees that died.
- Net — the difference, the figure that tells you which farm deserves expansion and which one is draining you.
Alongside it sits profit and loss per branch, for anyone with farms in more than one region.
Production volume
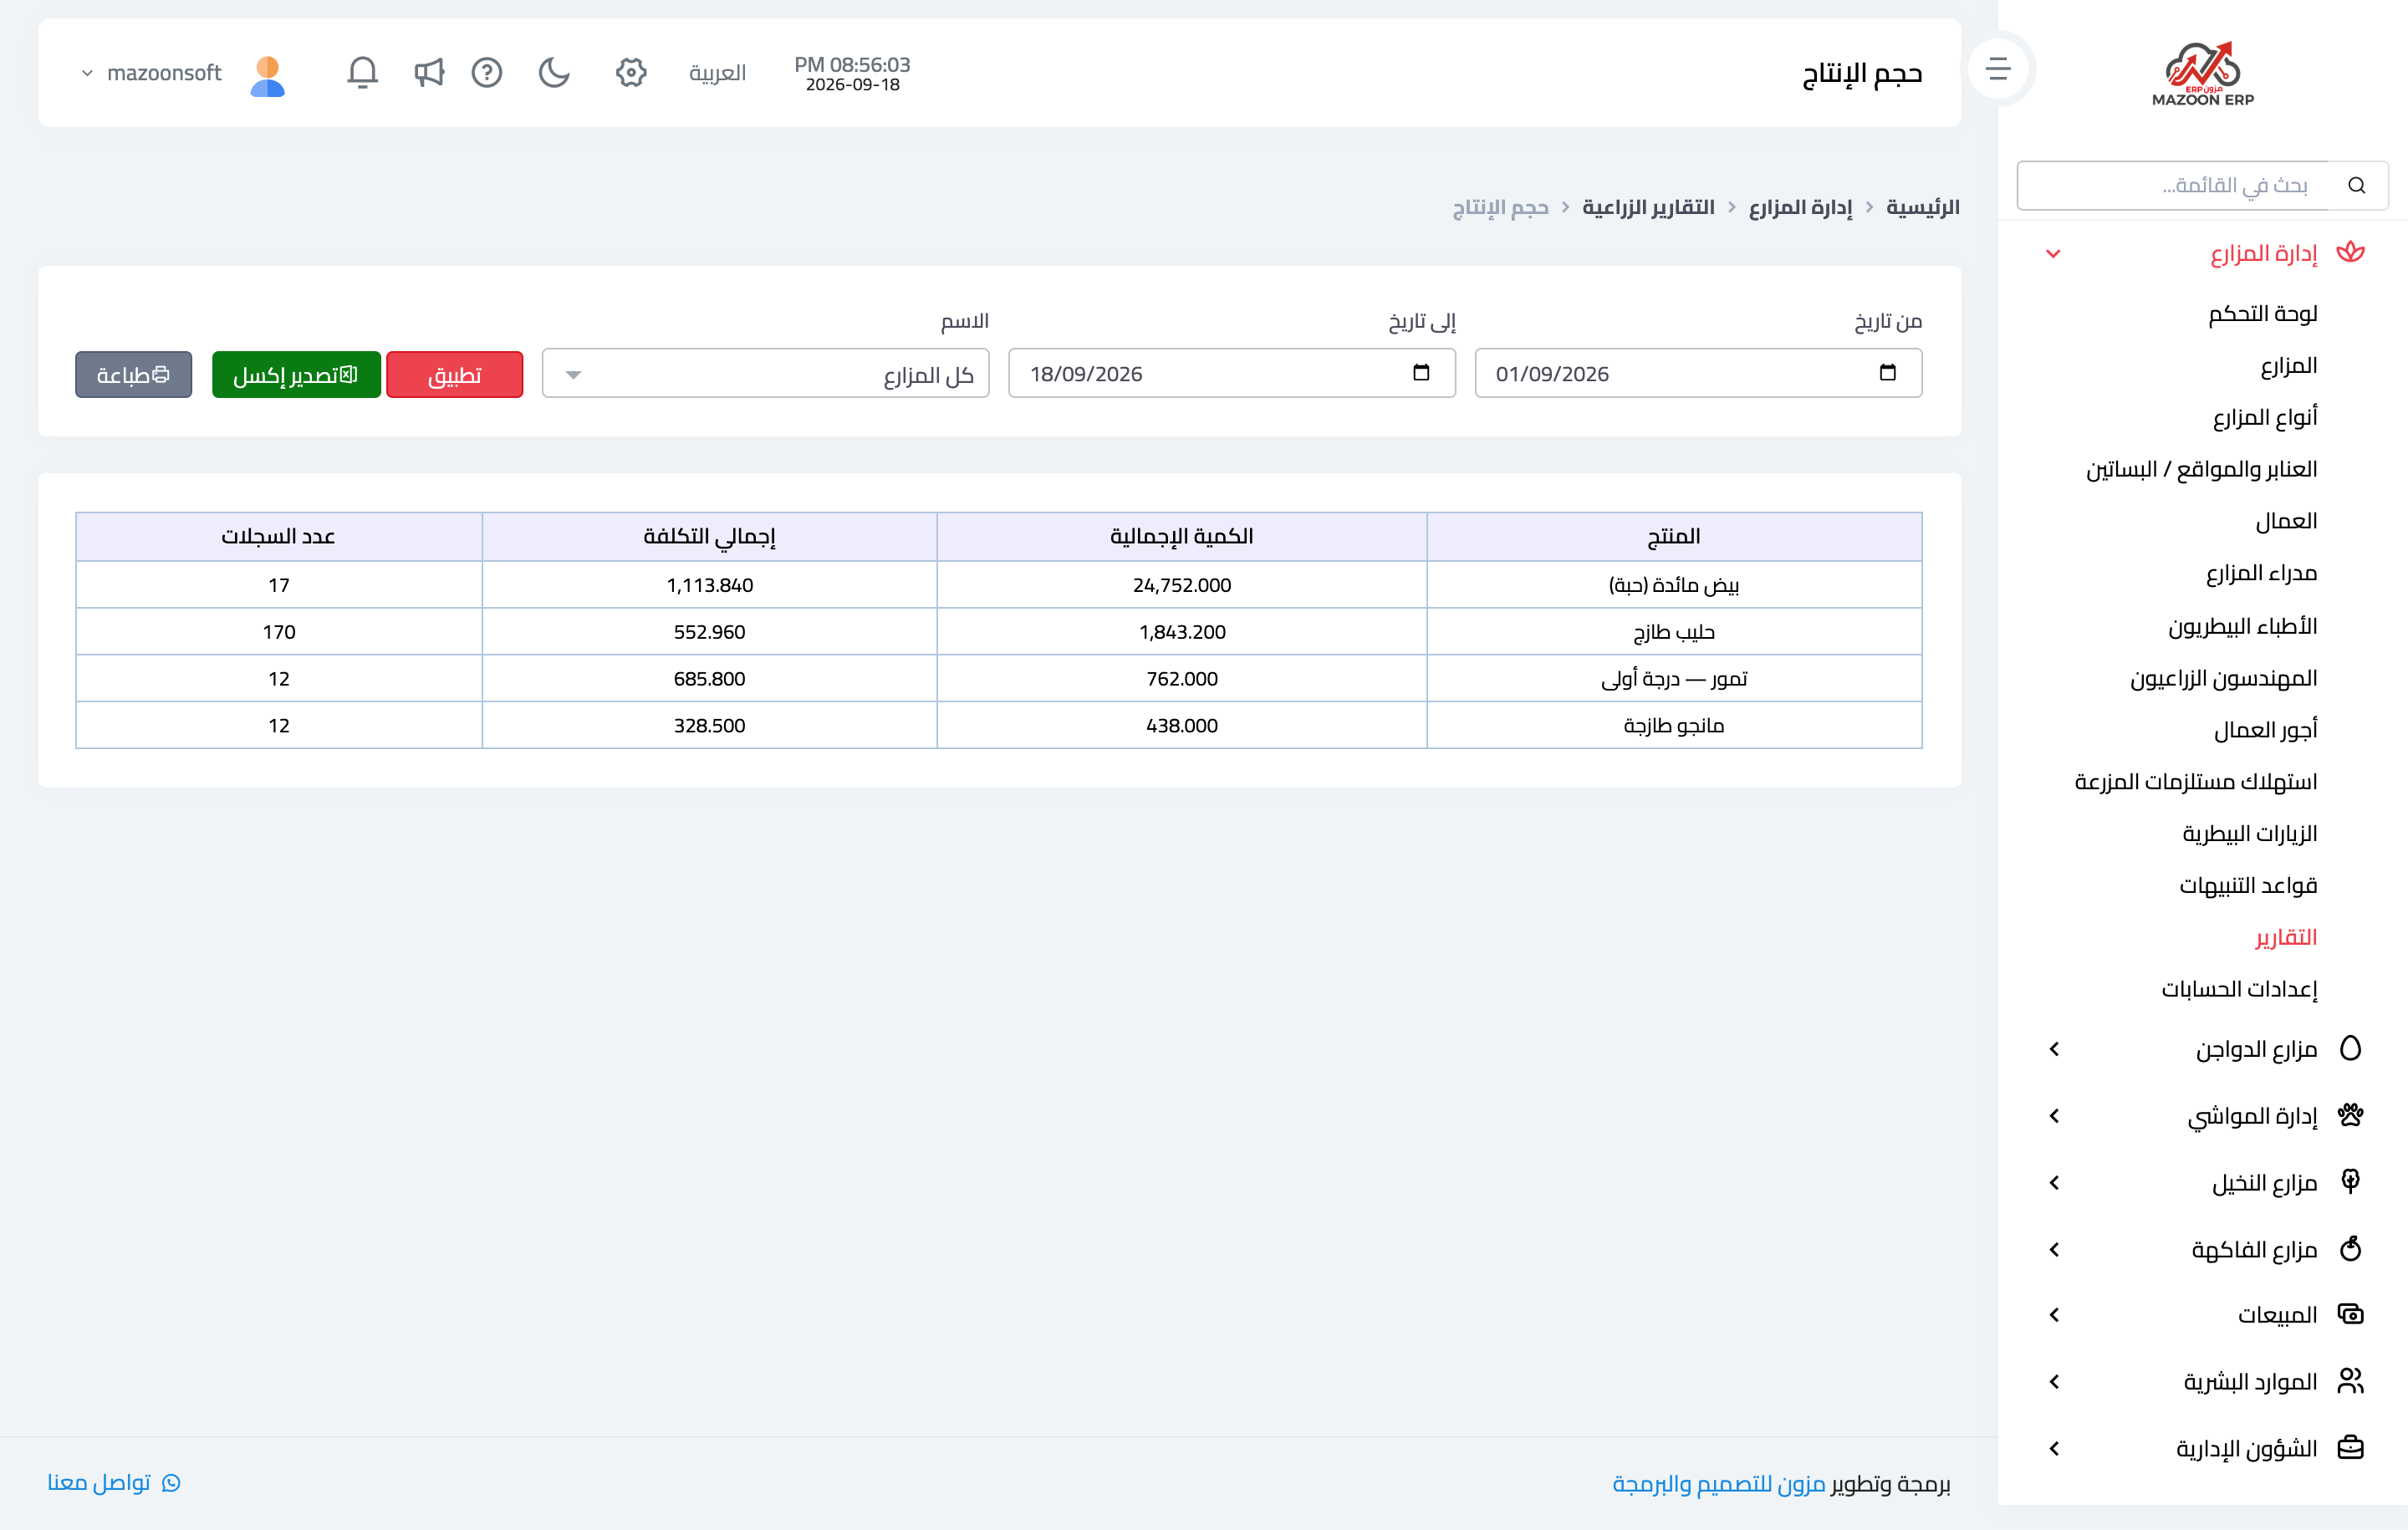
This report — Figure 2 — shows the product and its quantity over the period, split by farm. From it you see which house or orchard has slipped before the effect shows up in sales.
Mortality trend
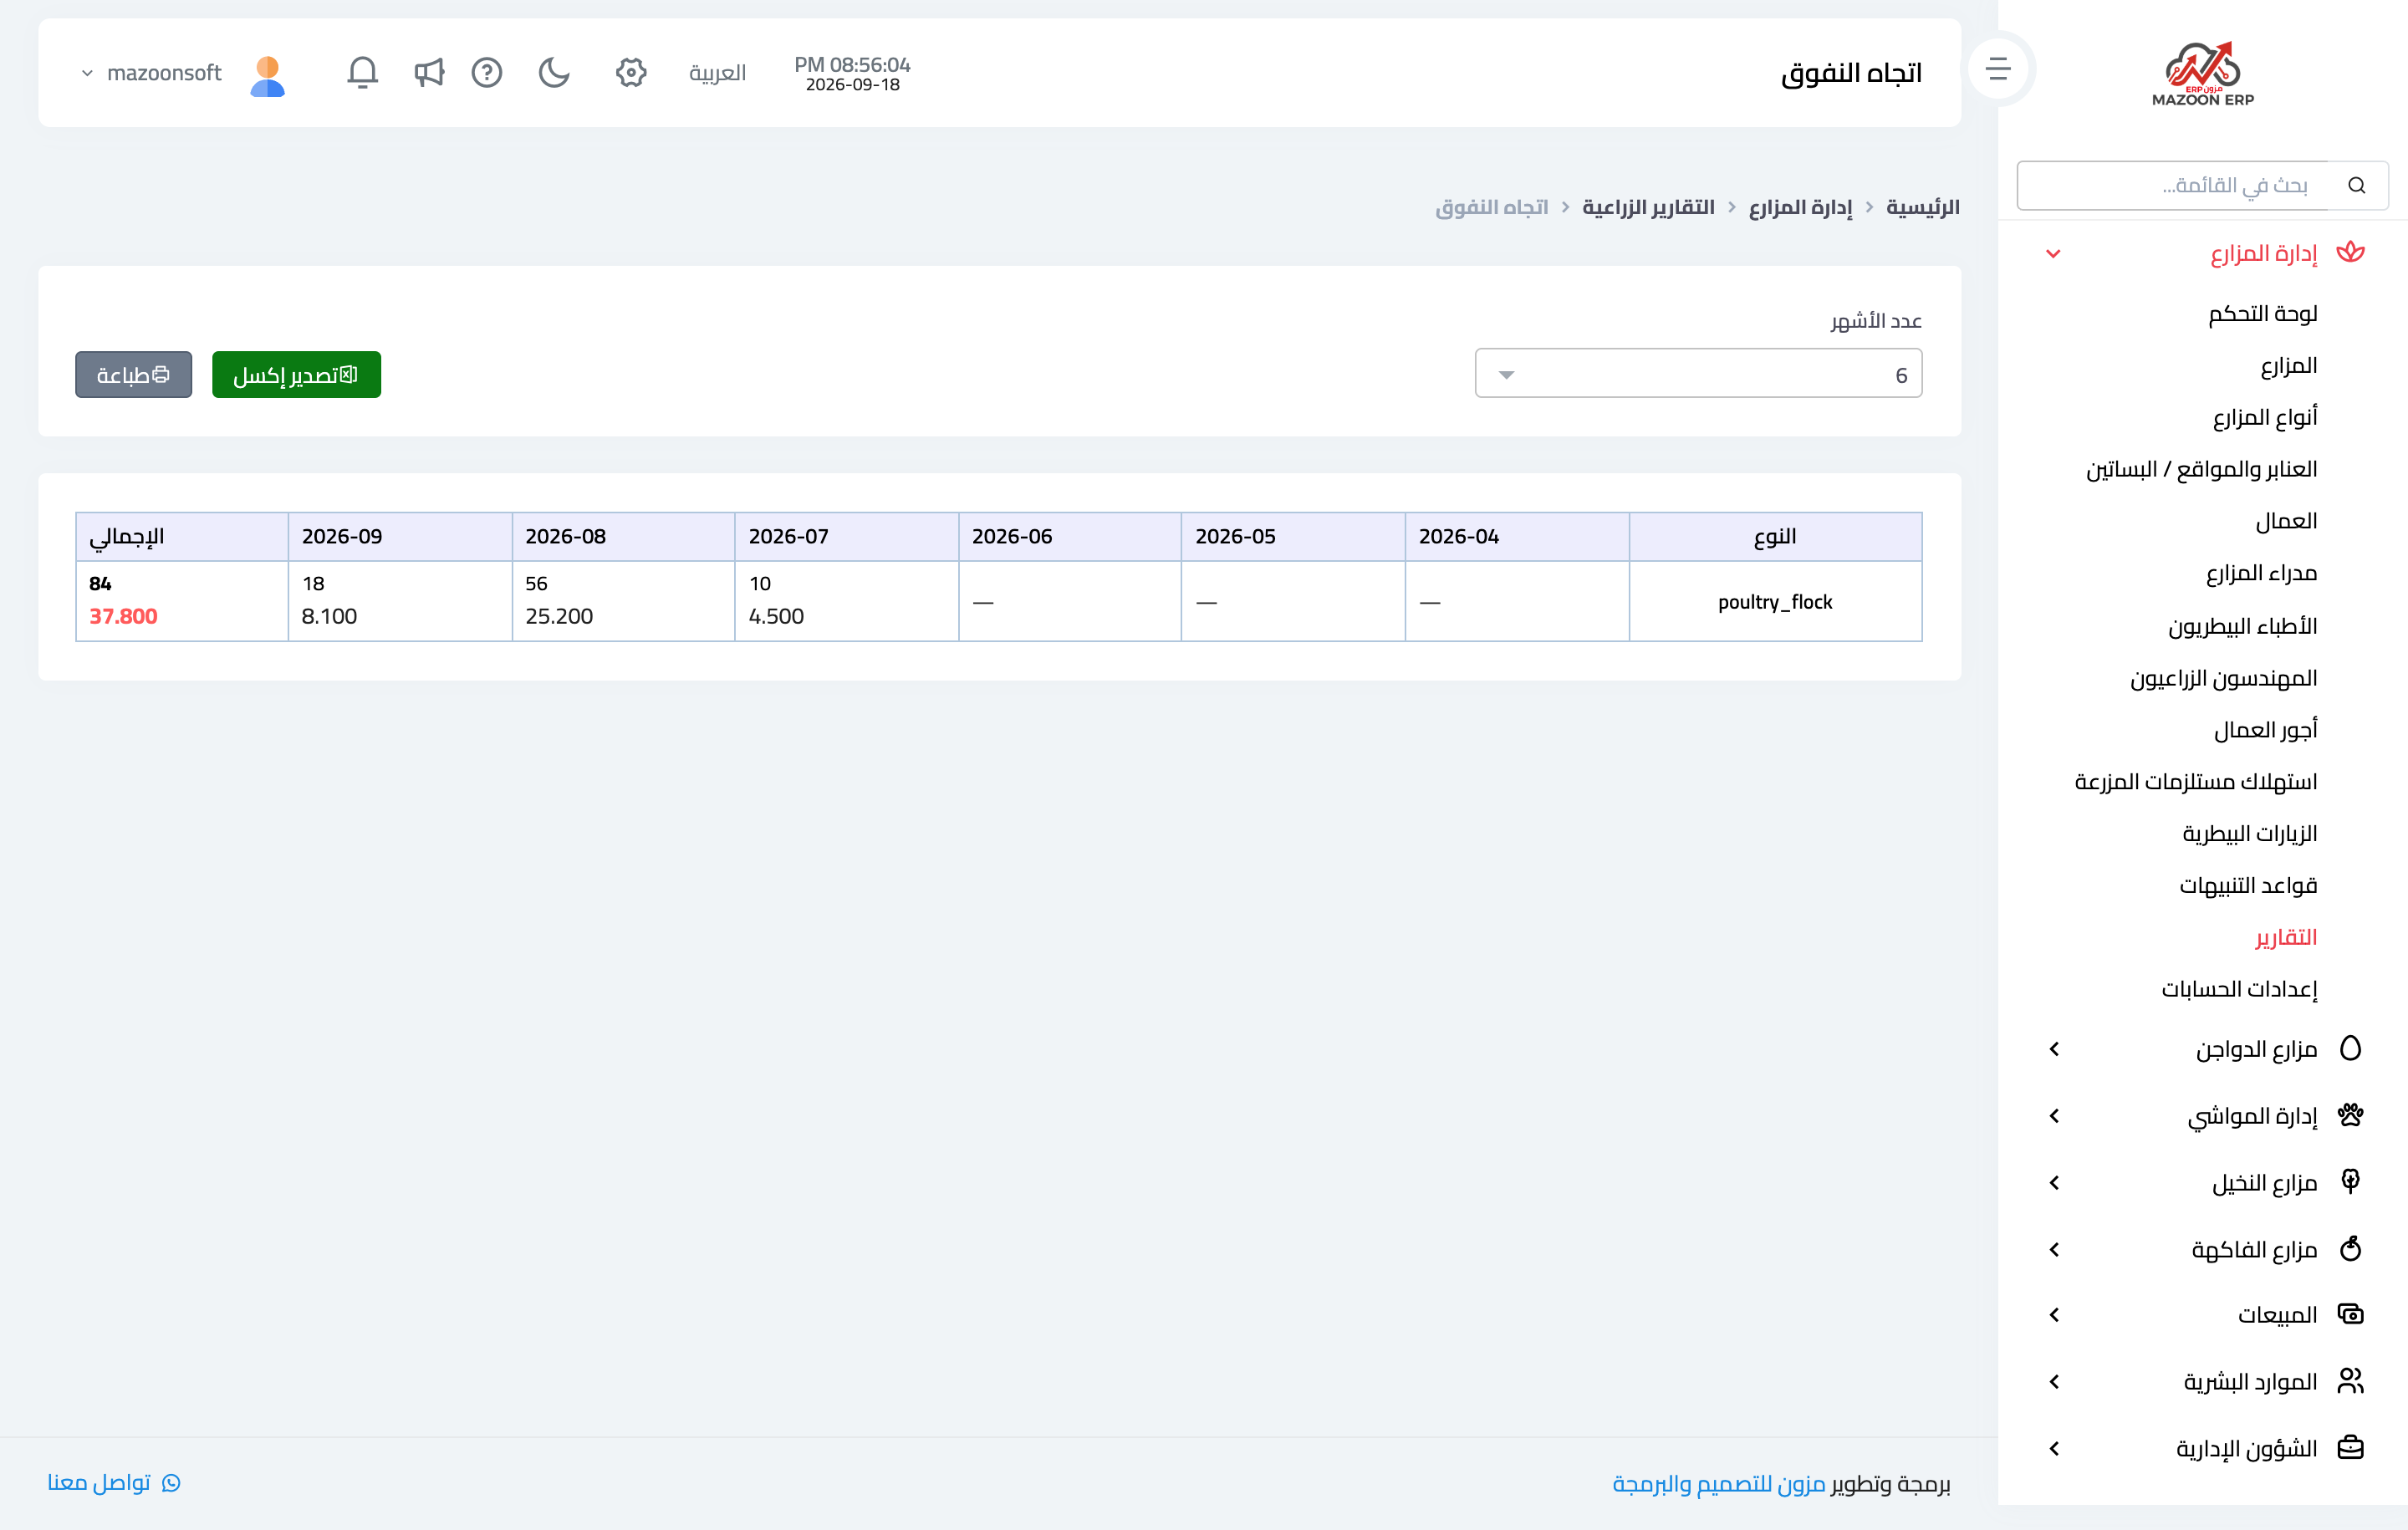
This report — Figure 3 — plots mortality across the past months, split by type. Reading it is simple: a steady line is normal, a sudden jump means disease, or a failure in ventilation or feed.
Where these figures come from
They are not typed in; they are built from three records that your daily work feeds:
- The production record — filled automatically from egg collection, milk, and the harvest records.
- Input consumption — filled from the feeding, treatment, and medication records.
- The mortality record — filled from flock, animal, and tree mortality.
So the report is a mirror of your discipline in recording; if a column comes up empty, the cause is an entry never made, not a fault in the report.
Notes
- Review the profitability report monthly, not yearly; a loss-making farm is fixed while it is losing, not after the year has closed.
- Compare input cost against production value farm by farm; the overall average hides the one that is failing.
- Do not read a new farm’s loss as failure; palms and fruit need years before they cover their cost.
- Keep the product prices in stock realistic; the production value is computed from them.
Screenshots
Try what you just read on your own data
Open a free 7-day trial — no credit card, with your own company link in minutes.