
Farms, houses, workers, and inputs
The farms module is built in two layers: a shared core that every farm uses whatever its activity — farms, houses, workers, inputs, and vet visits — and then a specialised module per activity (poultry, livestock, palm, fruit). This article covers the core.
The dashboard
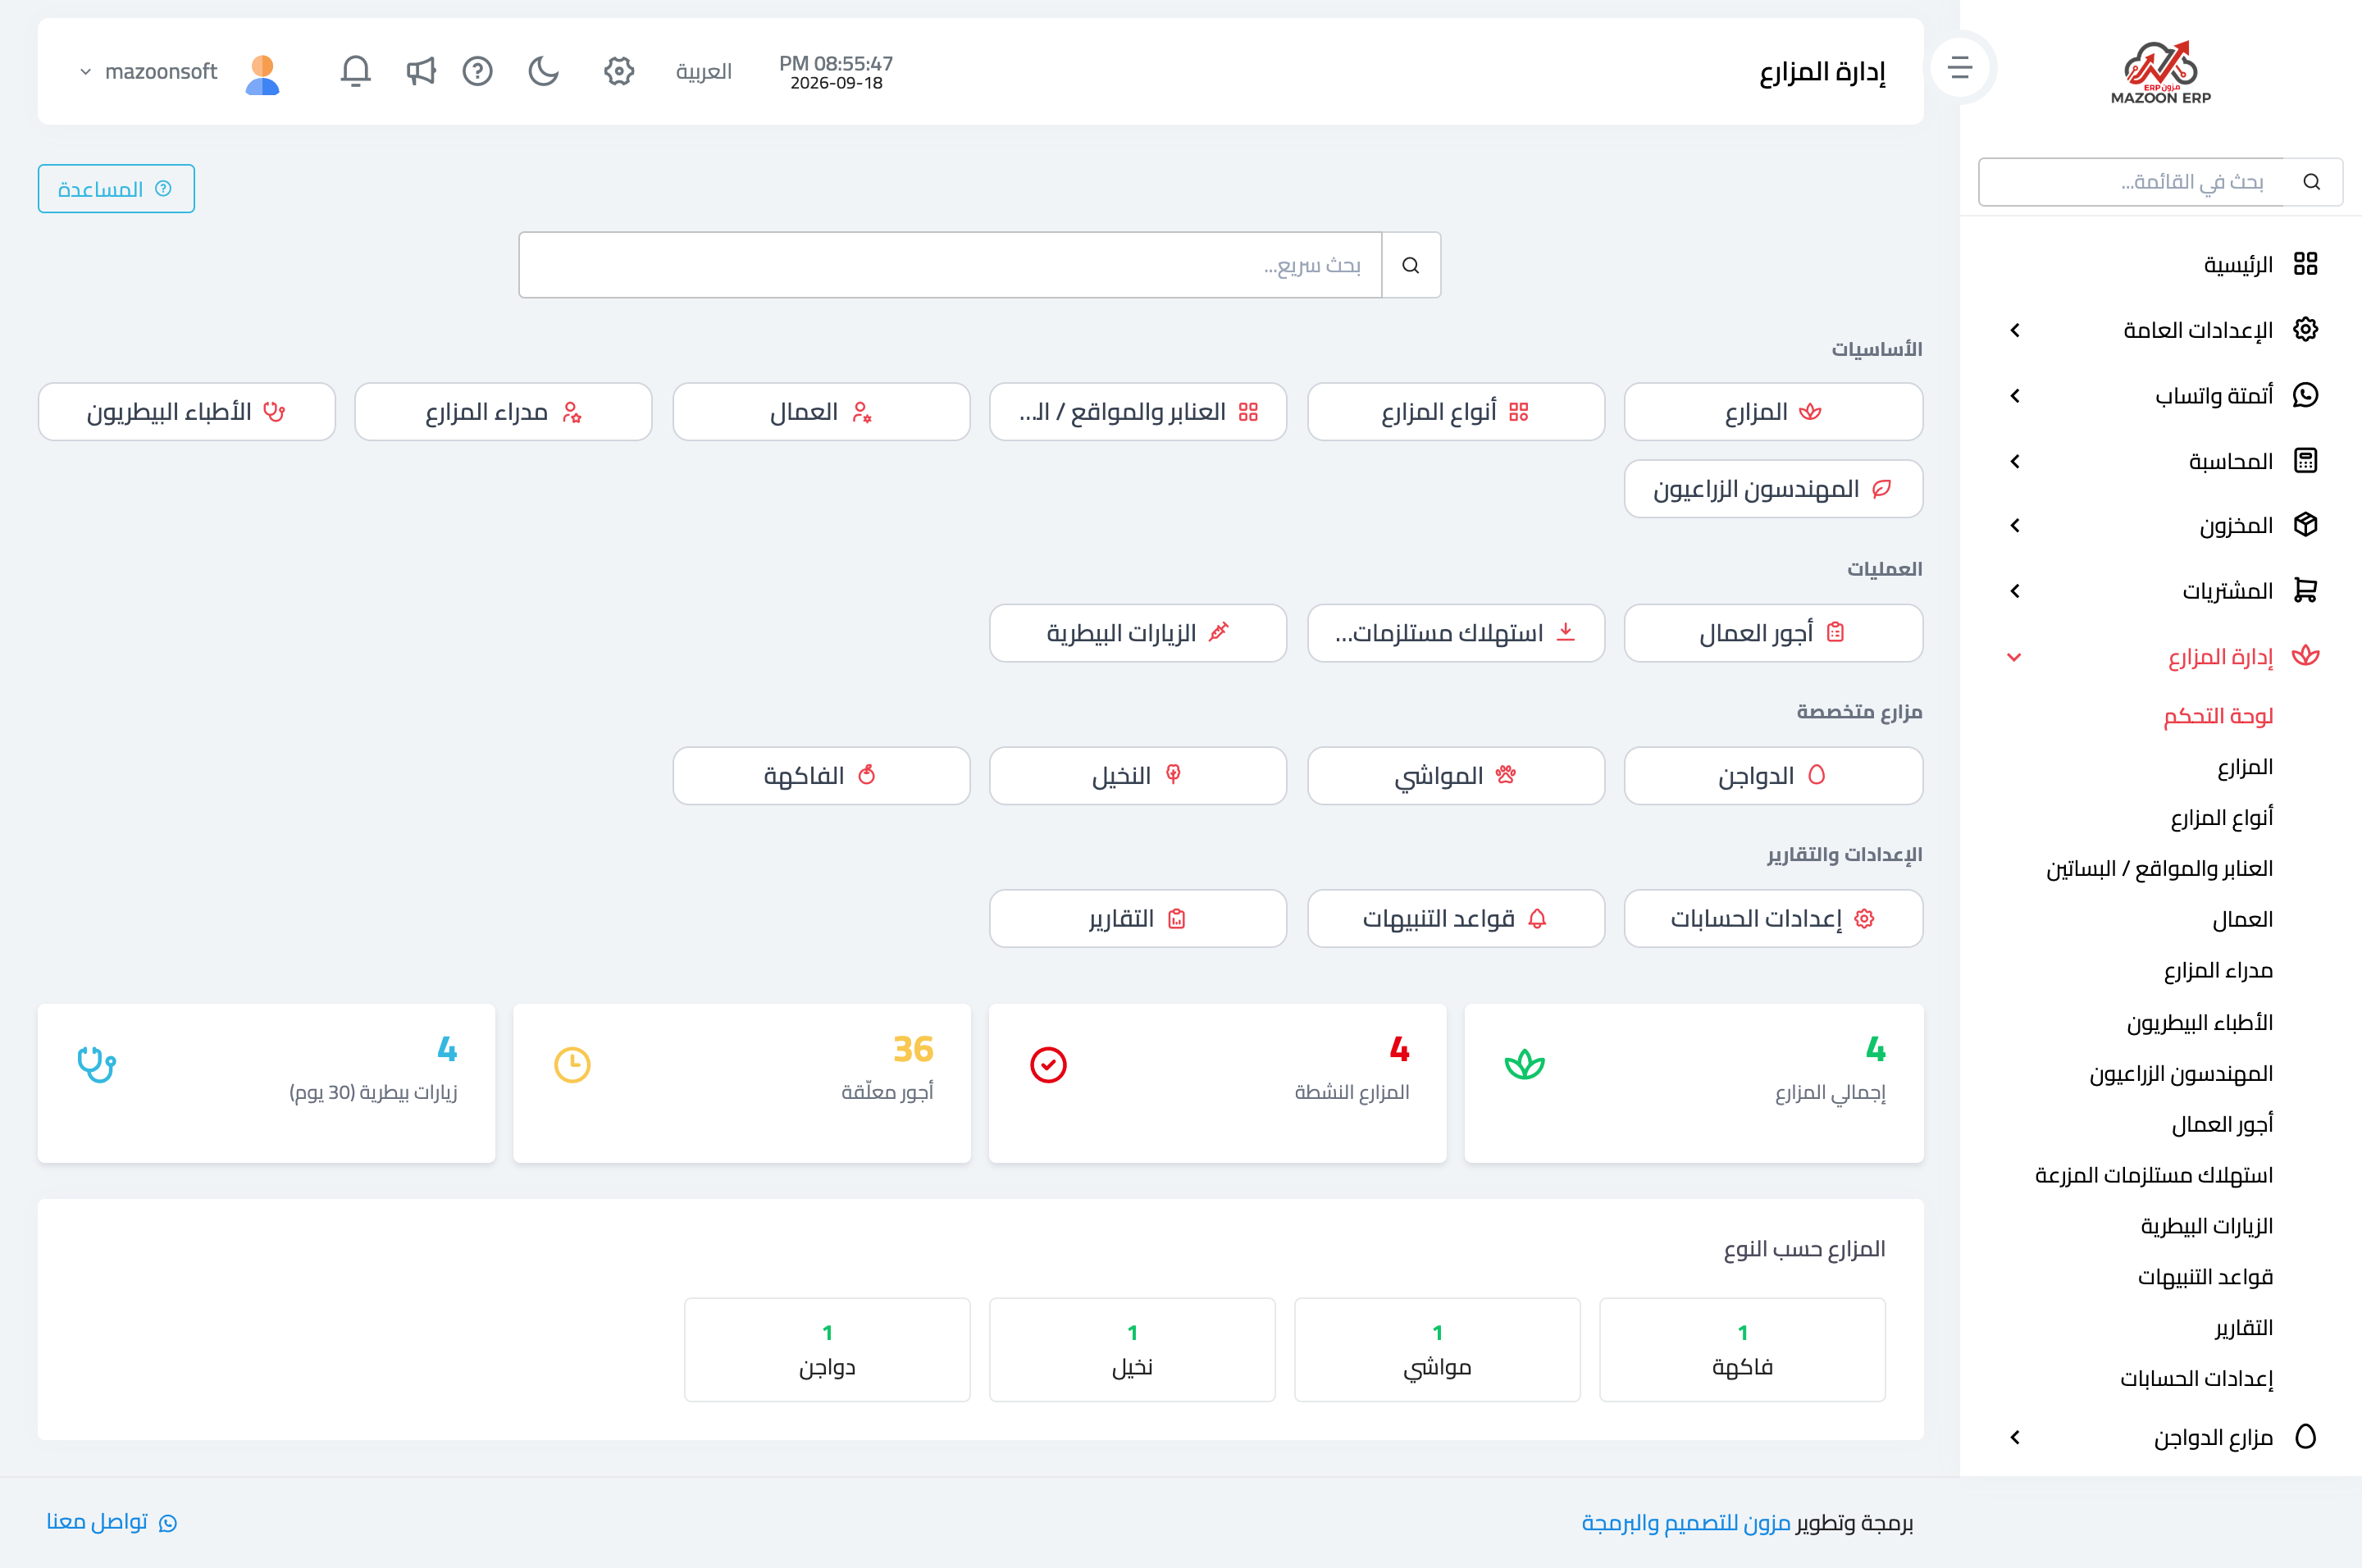
The farms dashboard — Figure 1 — gathers the entries in four groups: fundamentals, operations, specialised farms, and settings and reports. Below them sit today’s figures and the breakdown of farms by type.
Farms
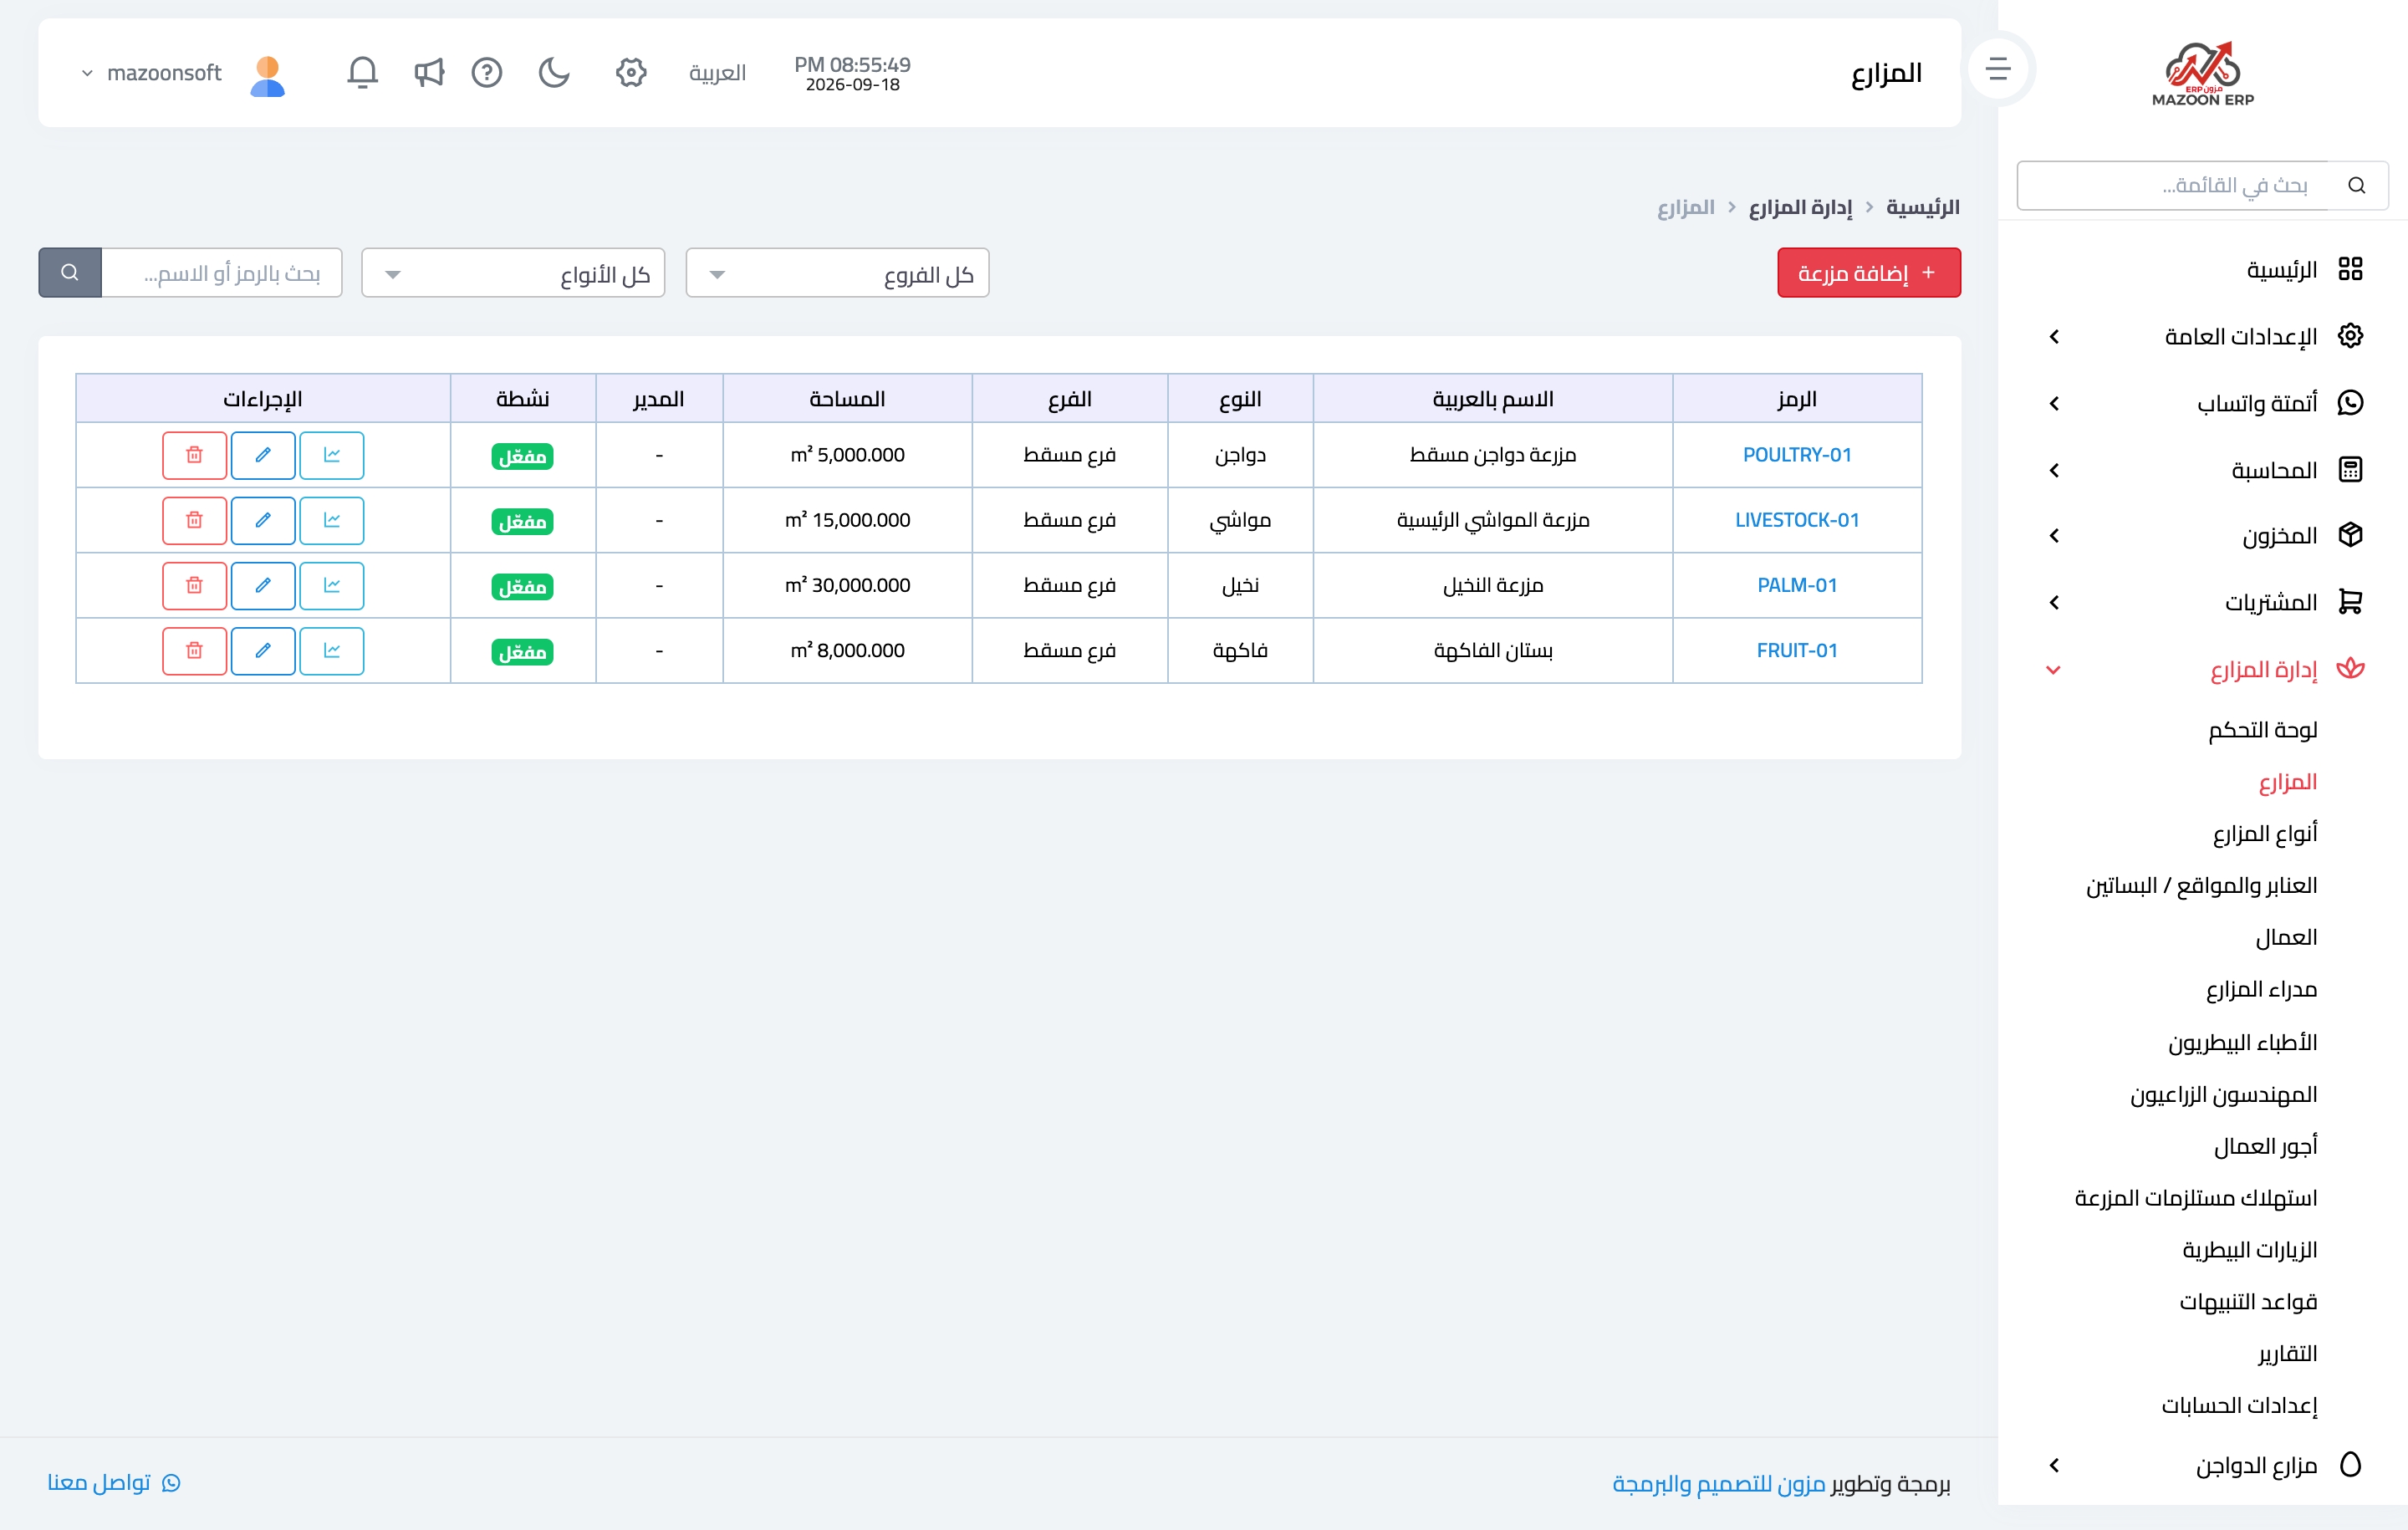
Each farm — Figure 2 — has a code, a name, a type, a location, an area, and an establishment date. The type is what decides which specialised modules act on it, so choose it carefully at creation.
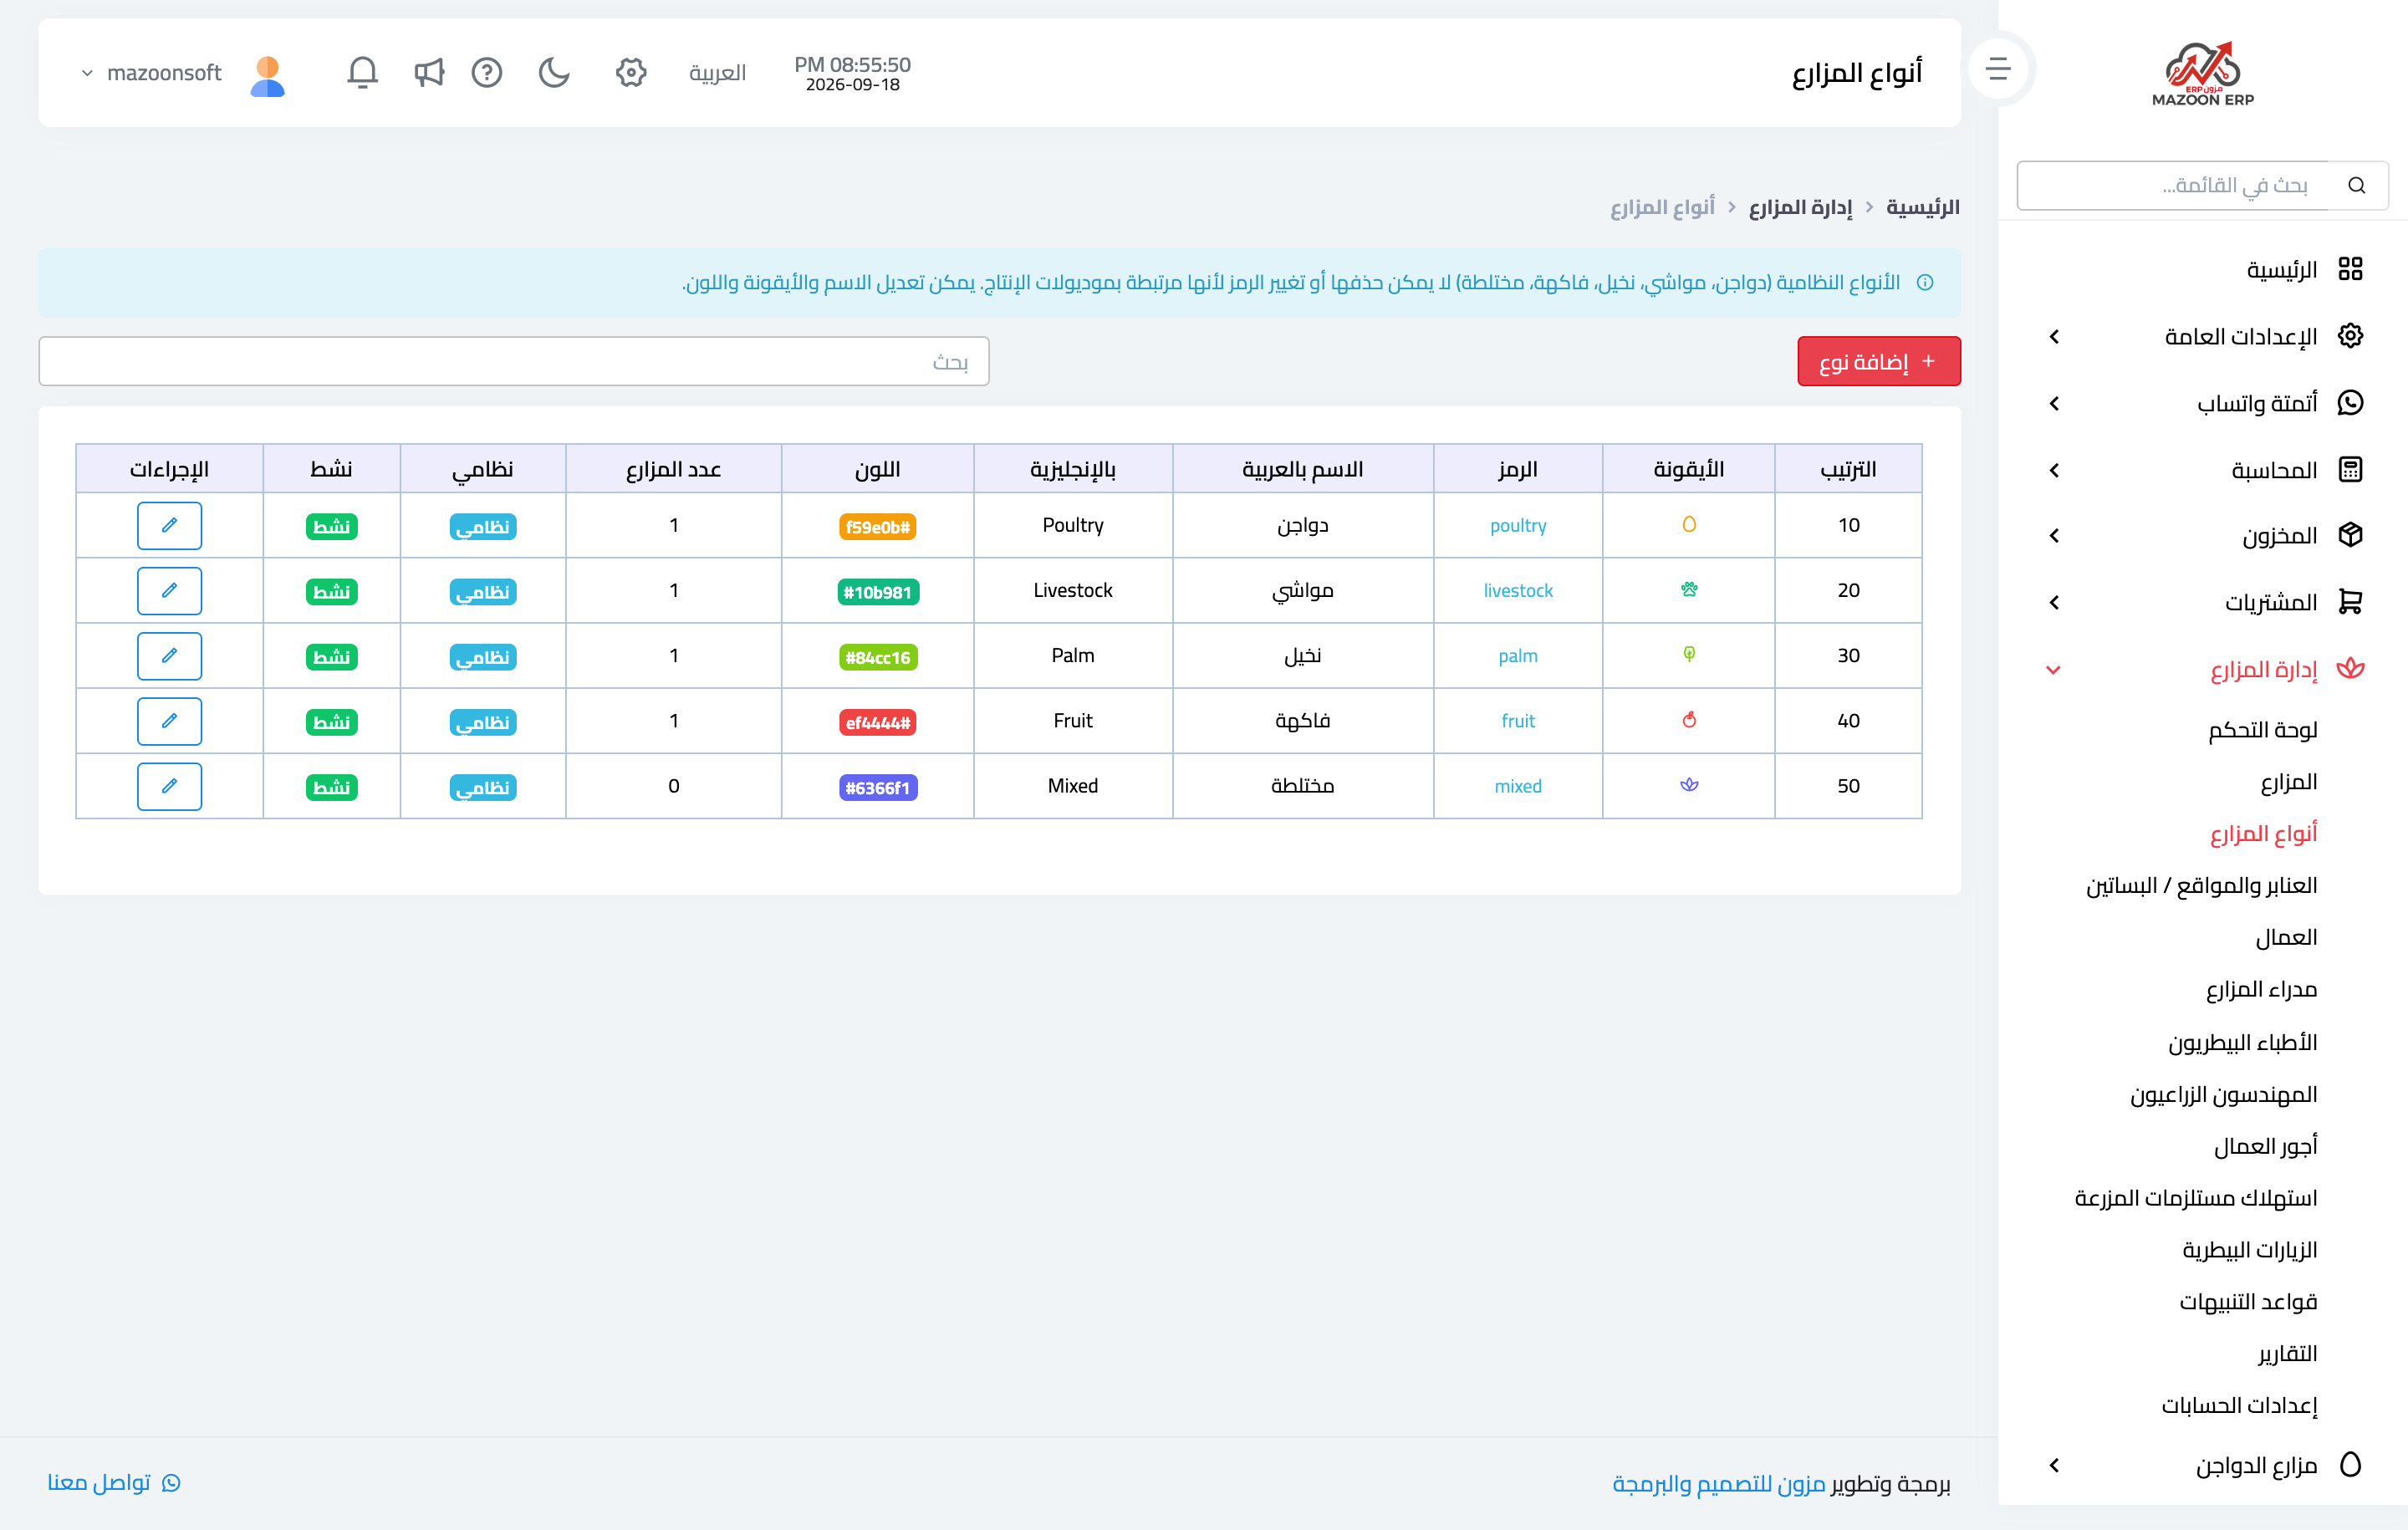
The farm types are managed on their own screen — Figure 3 — so you can add a type that suits your own activity.
Houses and locations
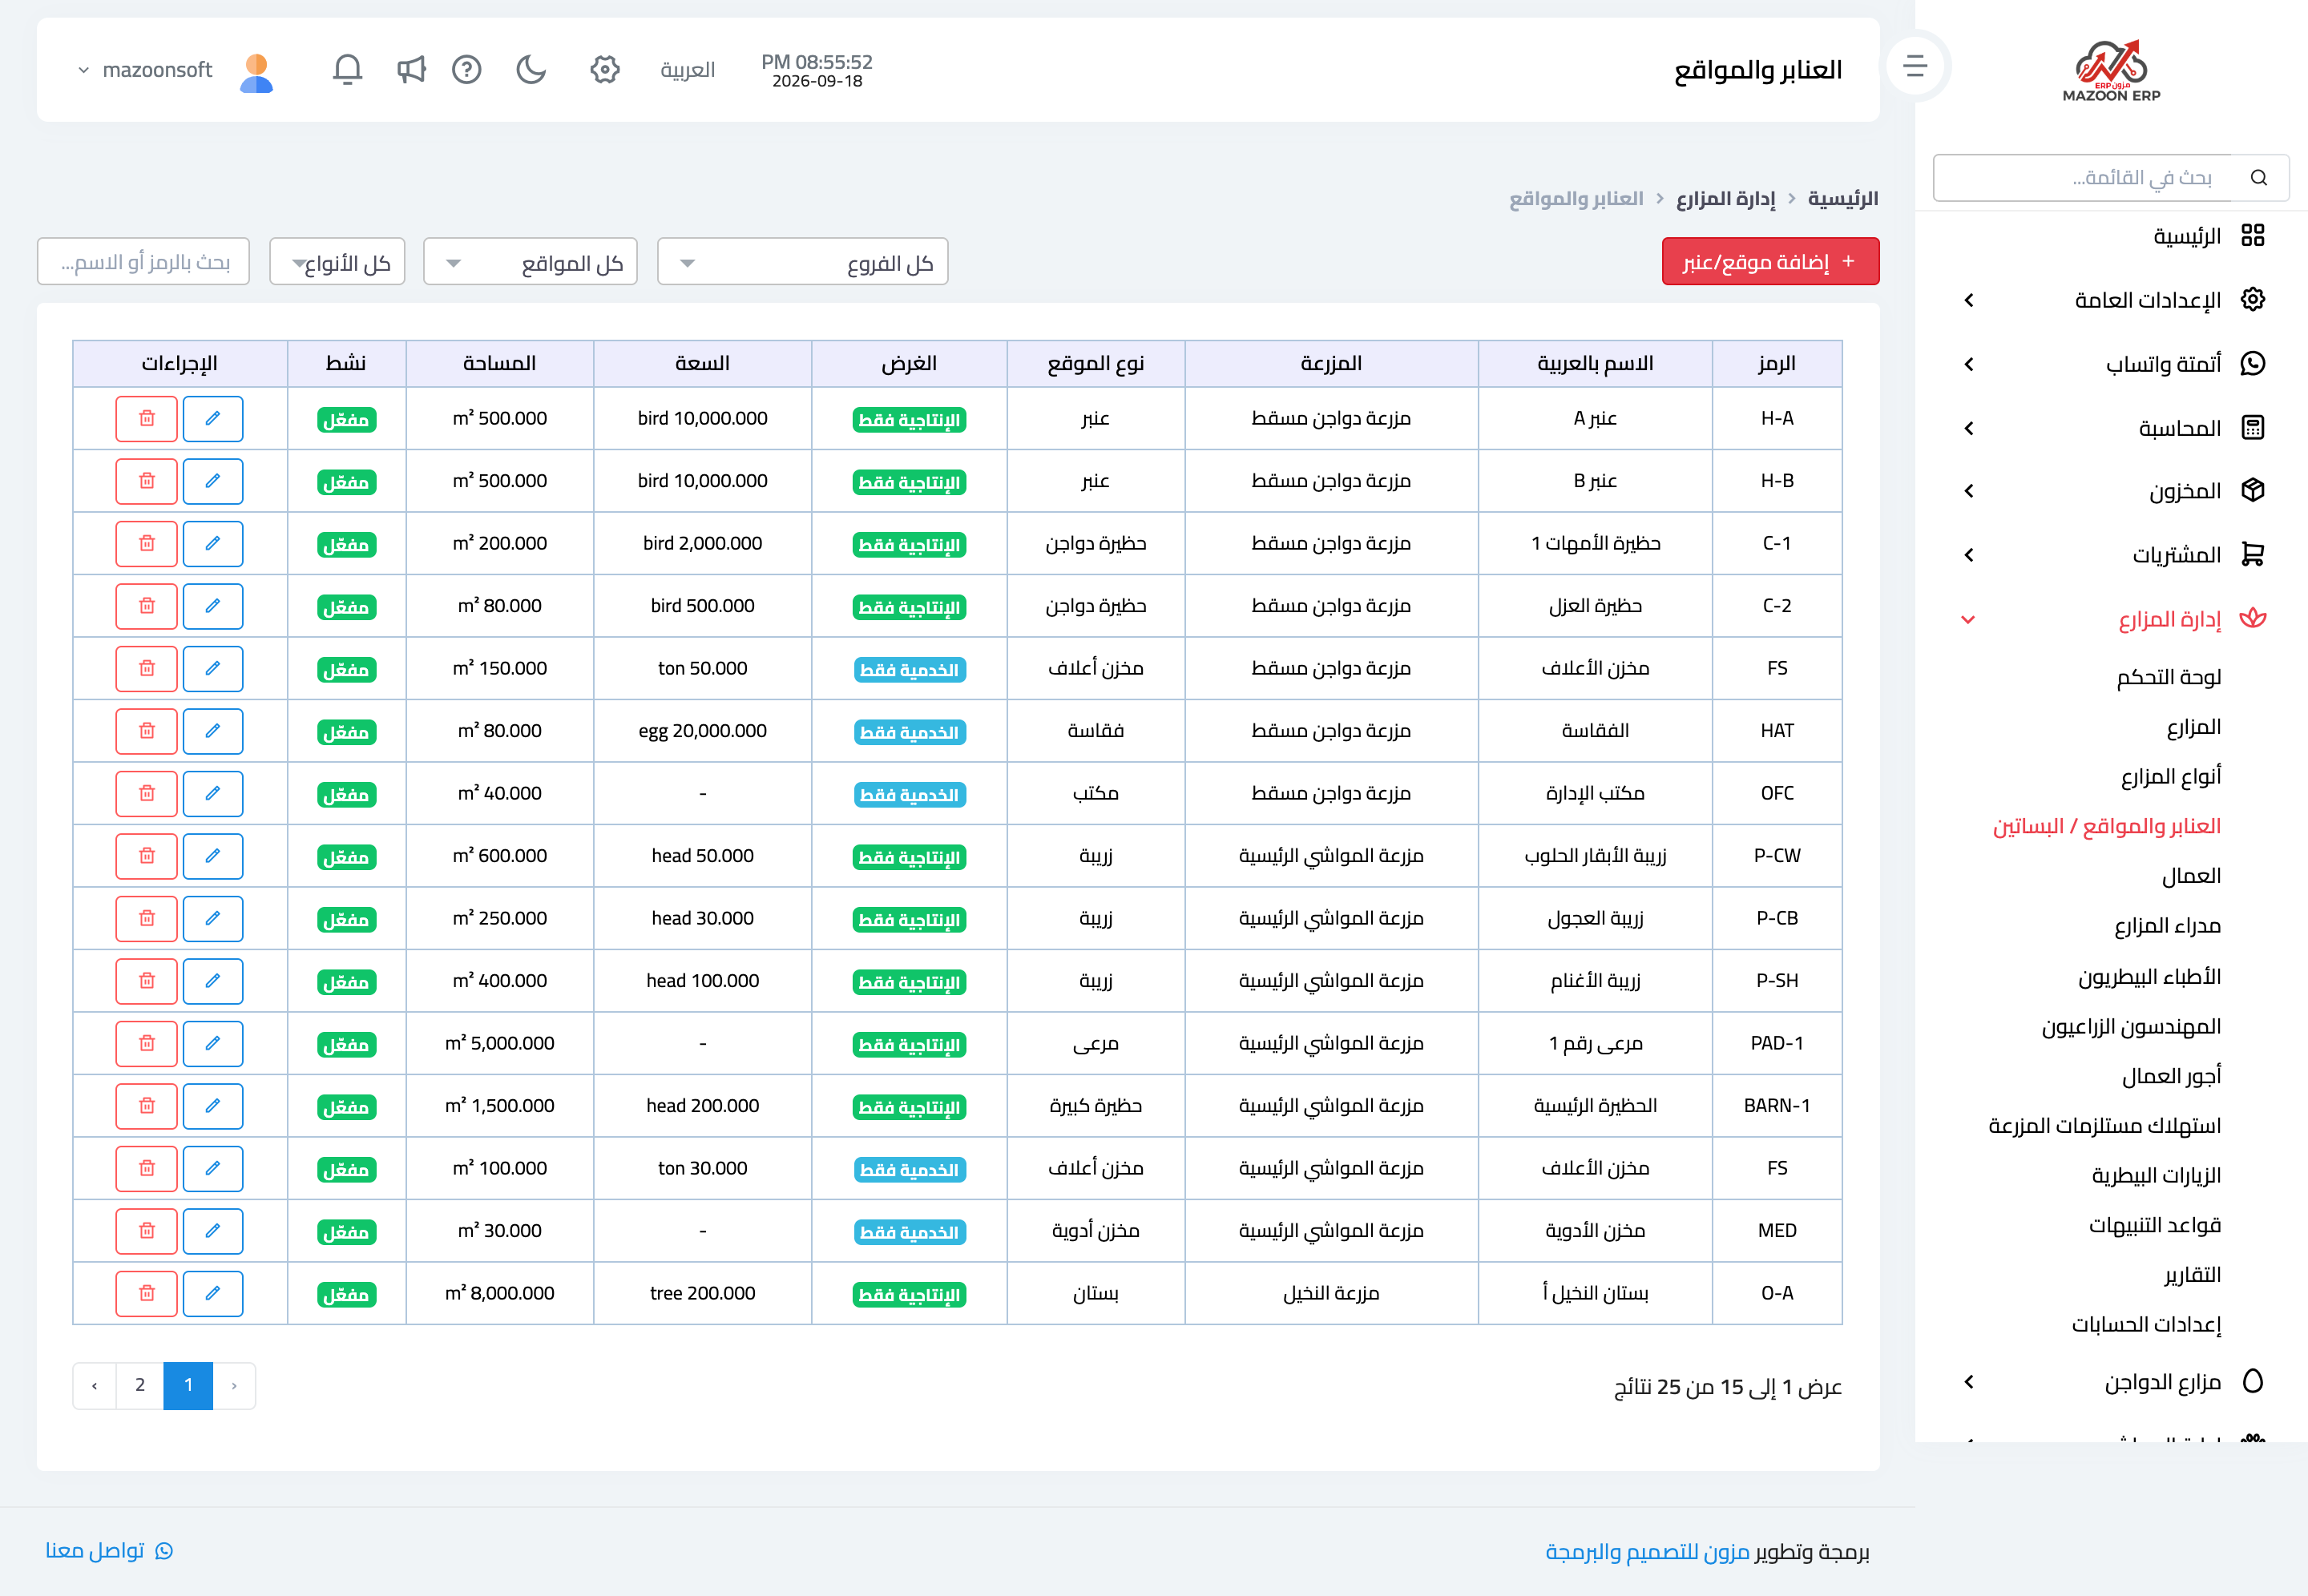
A farm is a wide container; the real work happens inside the houses and locations — Figure 4: a poultry house, a livestock pen, a palm orchard, a feed store, a medicine store, a packing facility.
Each location has a capacity in its own unit (bird, head, tree, ton) and an area, plus a switch marking it a production location or a service one. Only production locations can have flocks, animals, and trees assigned to them.
Workers and their wages
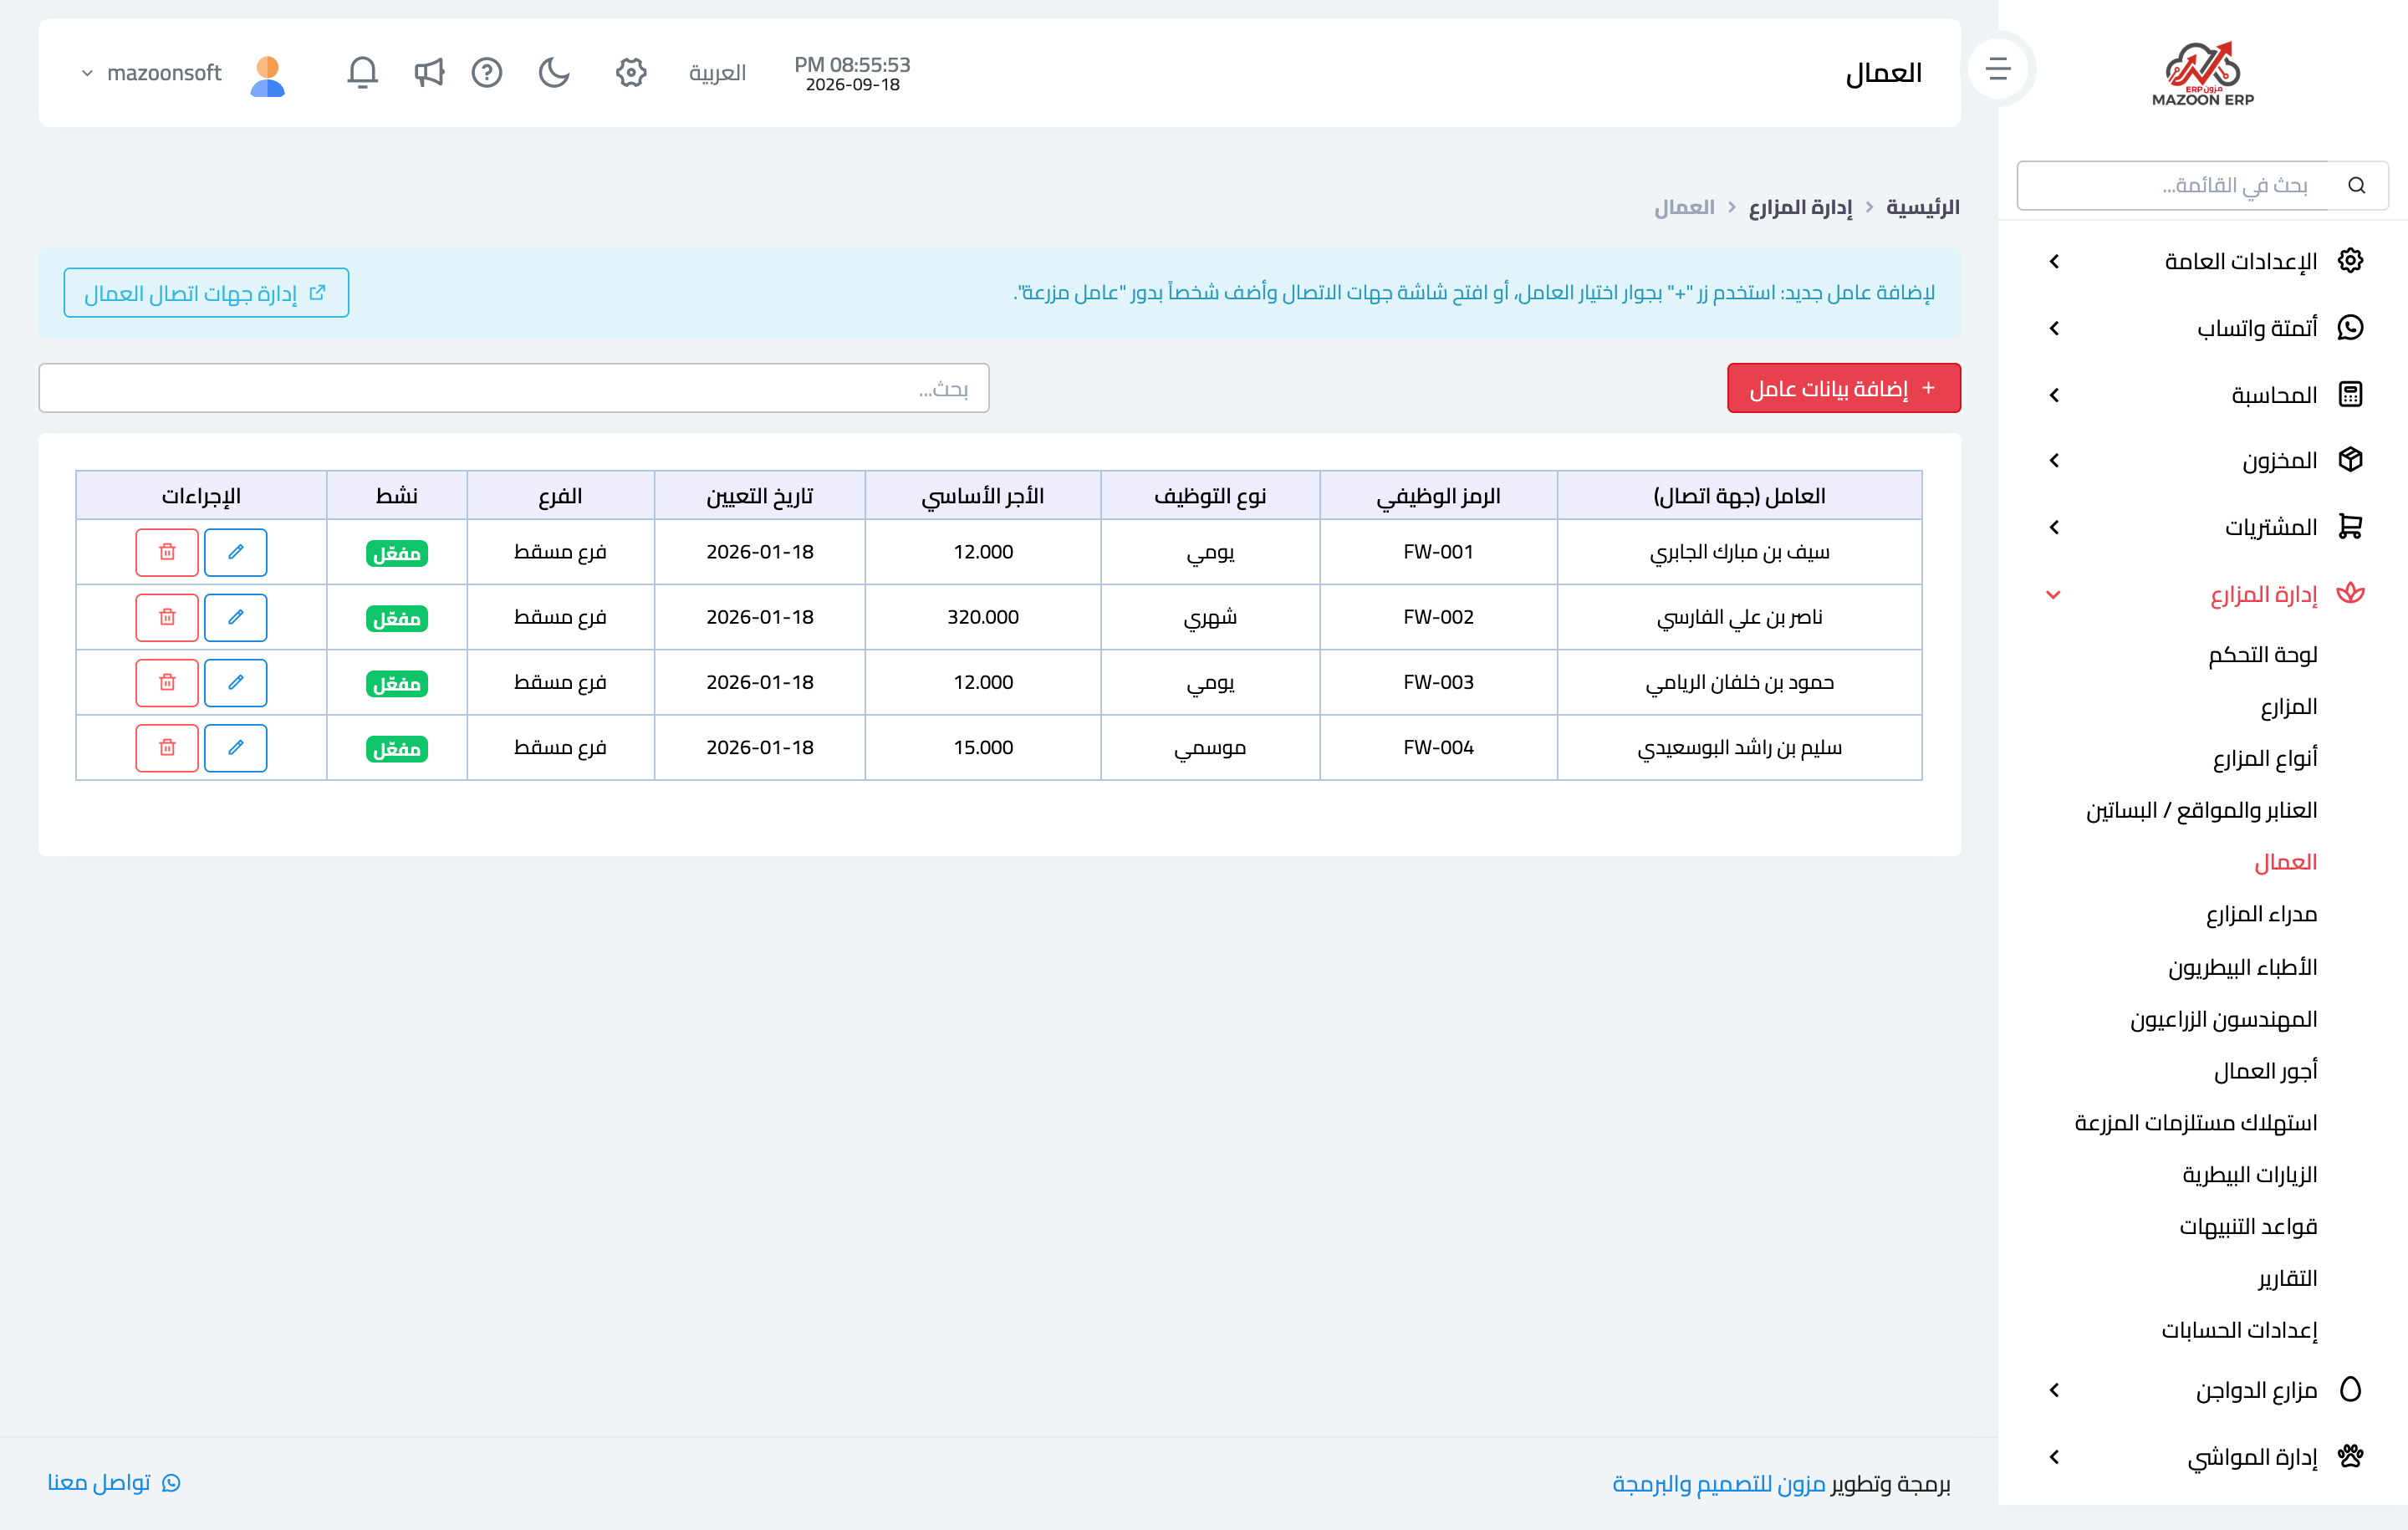
A farm worker — Figure 5 — is usually not an HR employee; they work by the day, by the season, or by the piece. So they have their own profile carrying the employment type and the base rate.
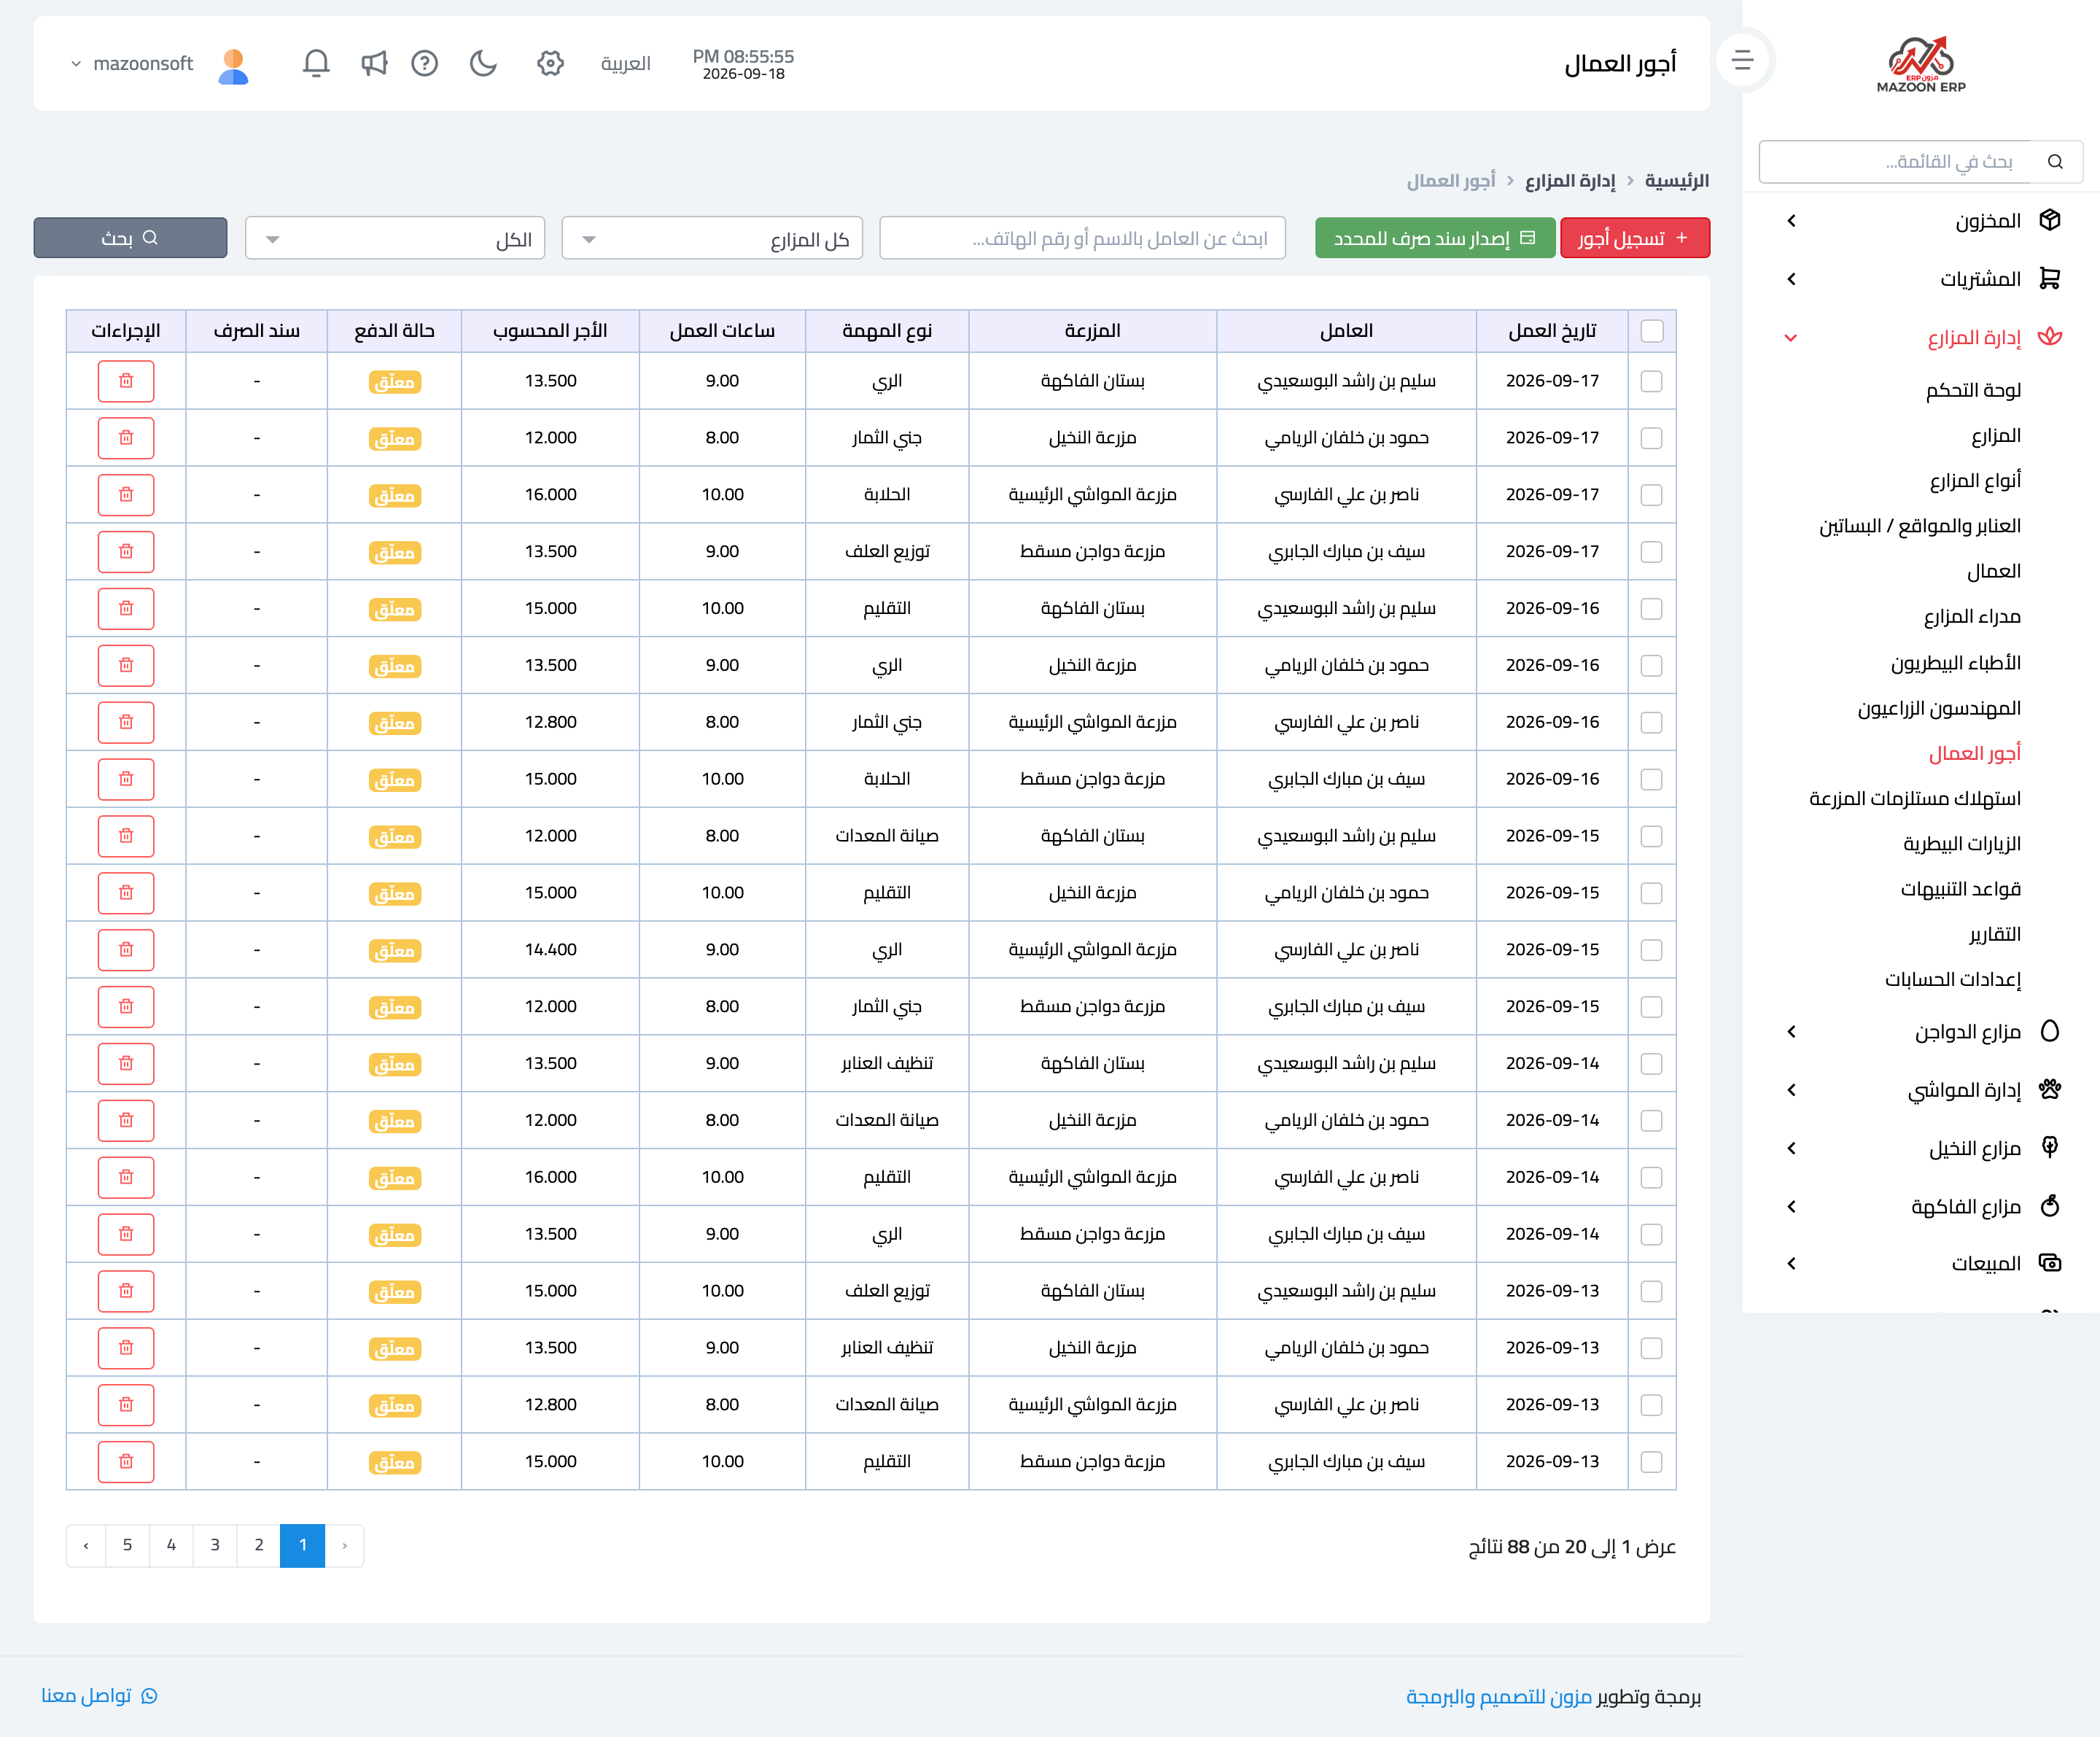
On the worker wages screen — Figure 6 — you record for each day: the worker, the farm, the location, the kind of work, and the hours; the system computes the wage and tracks what is paid against what is pending.
Vet visits
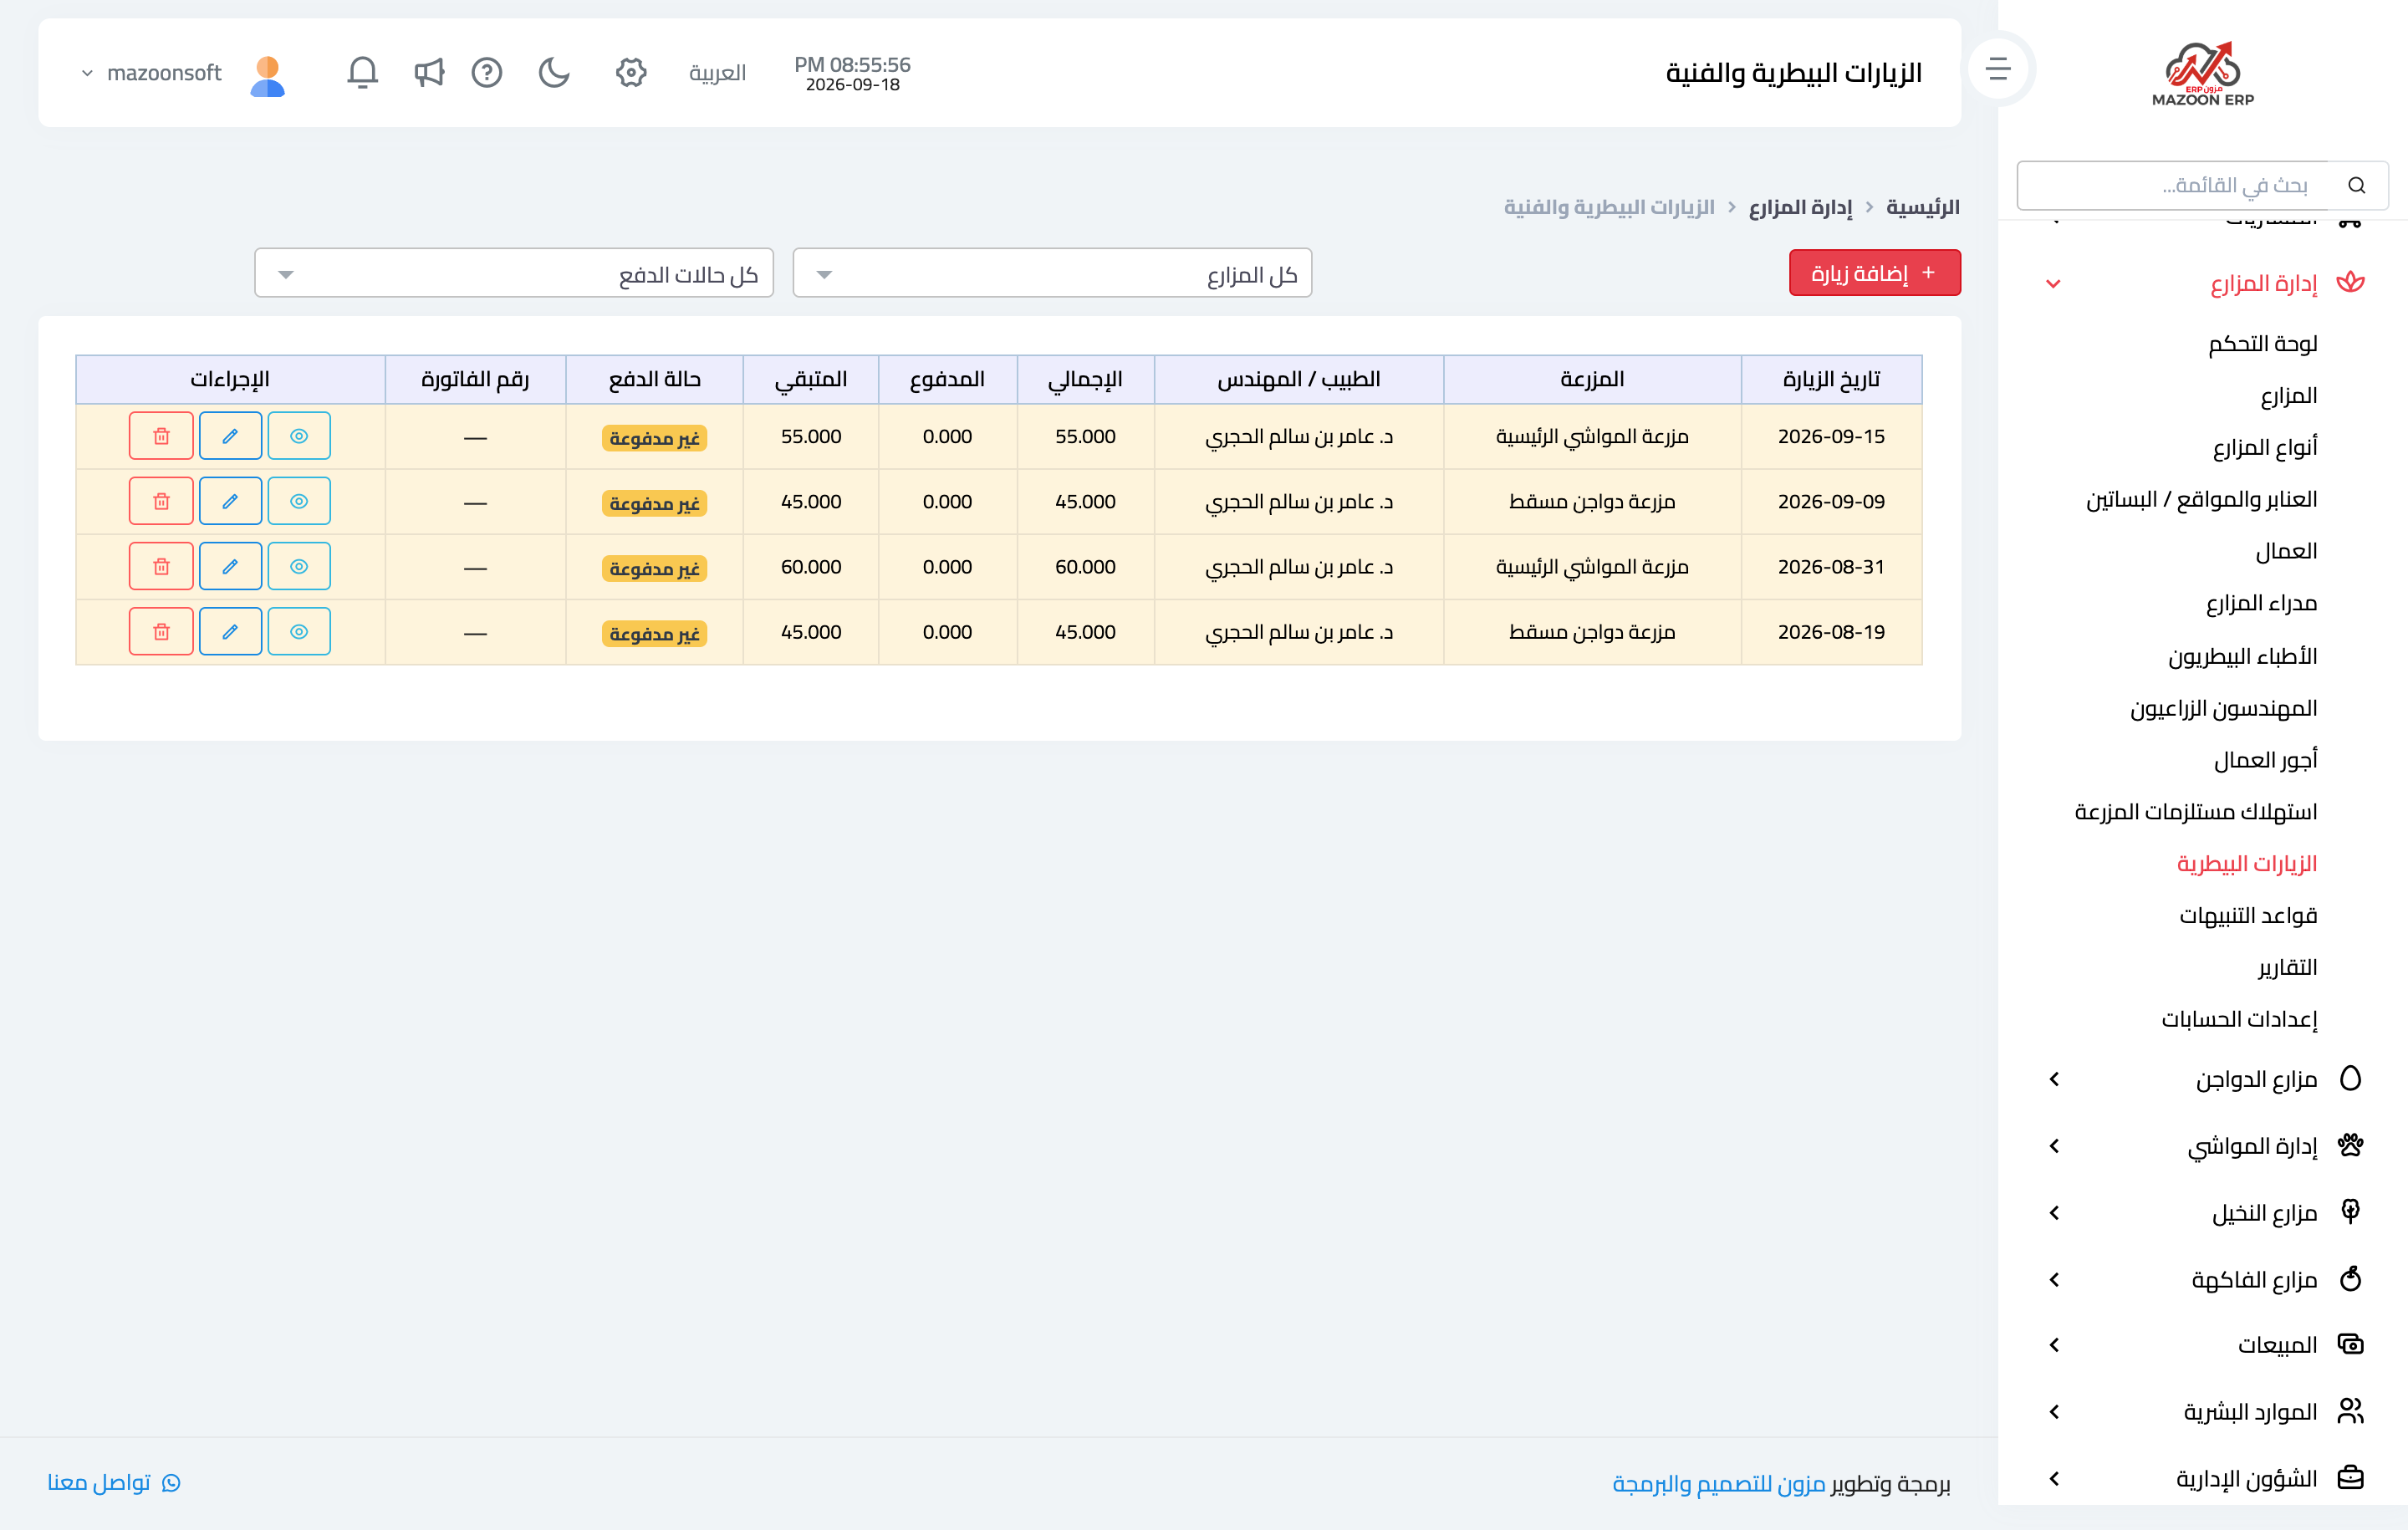
Every visit by a vet or an agronomist is recorded — Figure 7 — with its farm, location, date, and fee, so the fee lands in that farm’s cost rather than in some anonymous general expense.
Input consumption
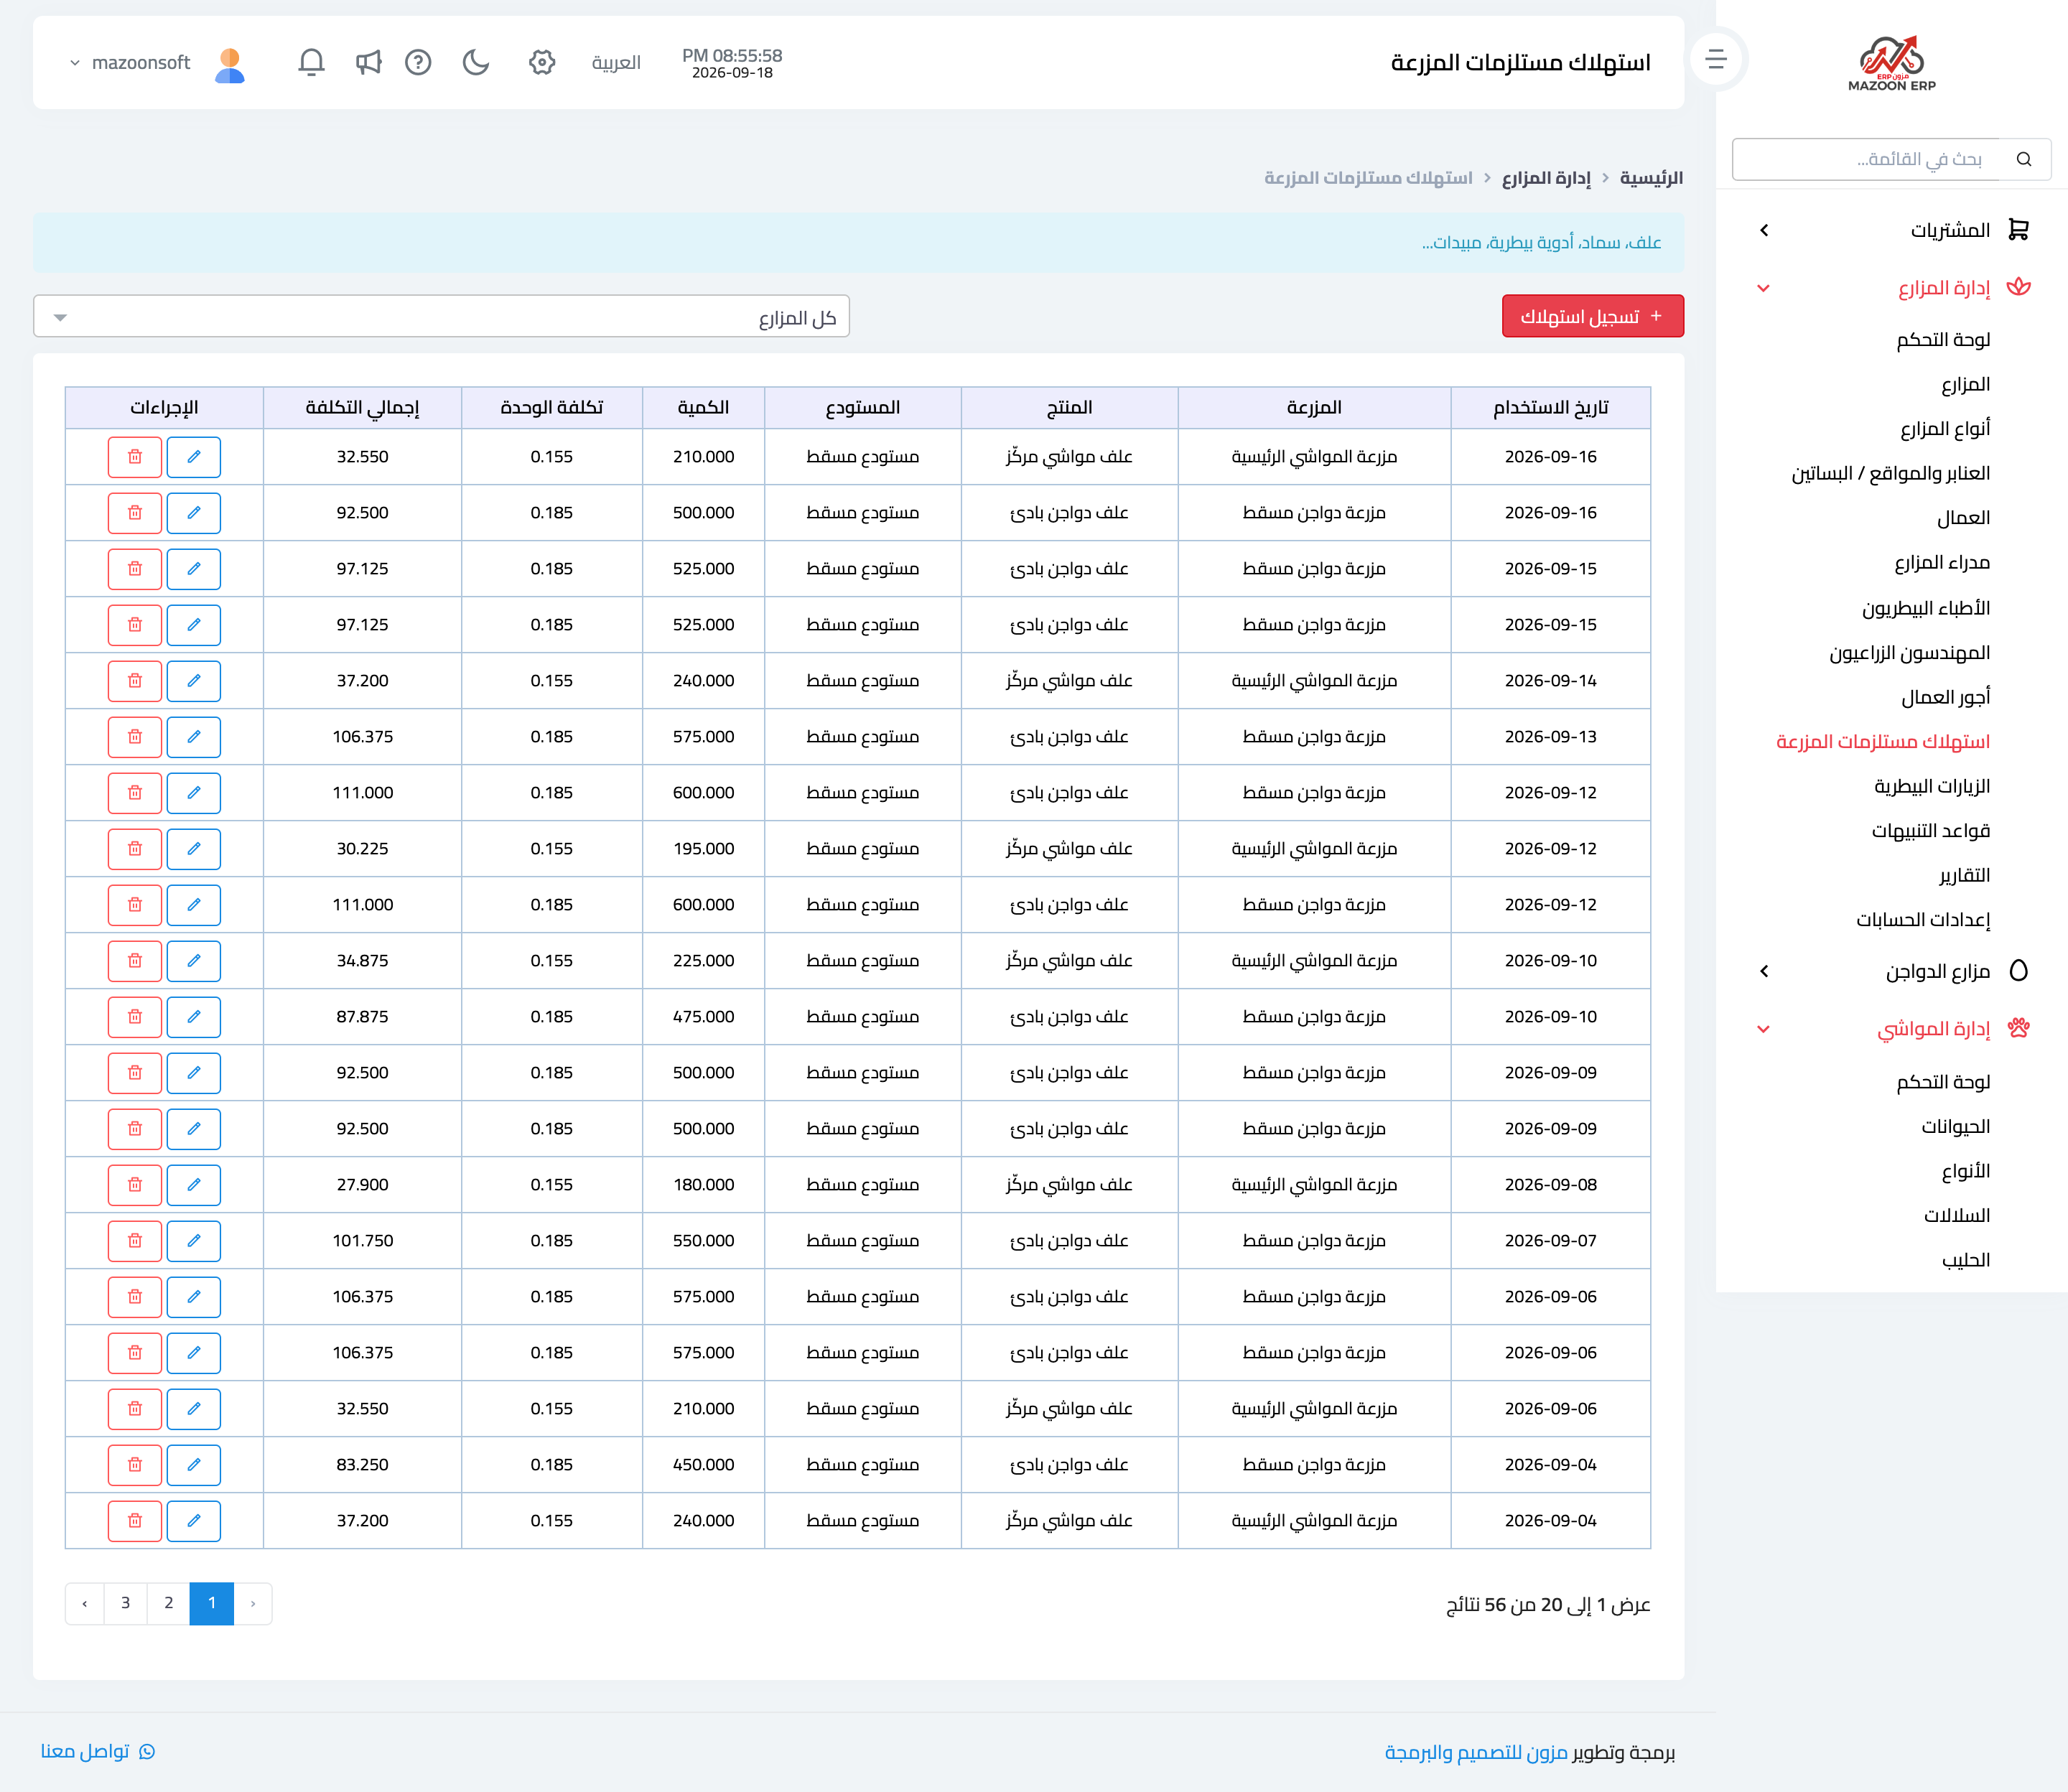
Everything issued from the store to the farm — Figure 8 — feed, medicine, or fertiliser — is recorded here with its quantity, cost, and location. This is what builds the input cost in the profitability report.
Alert rules
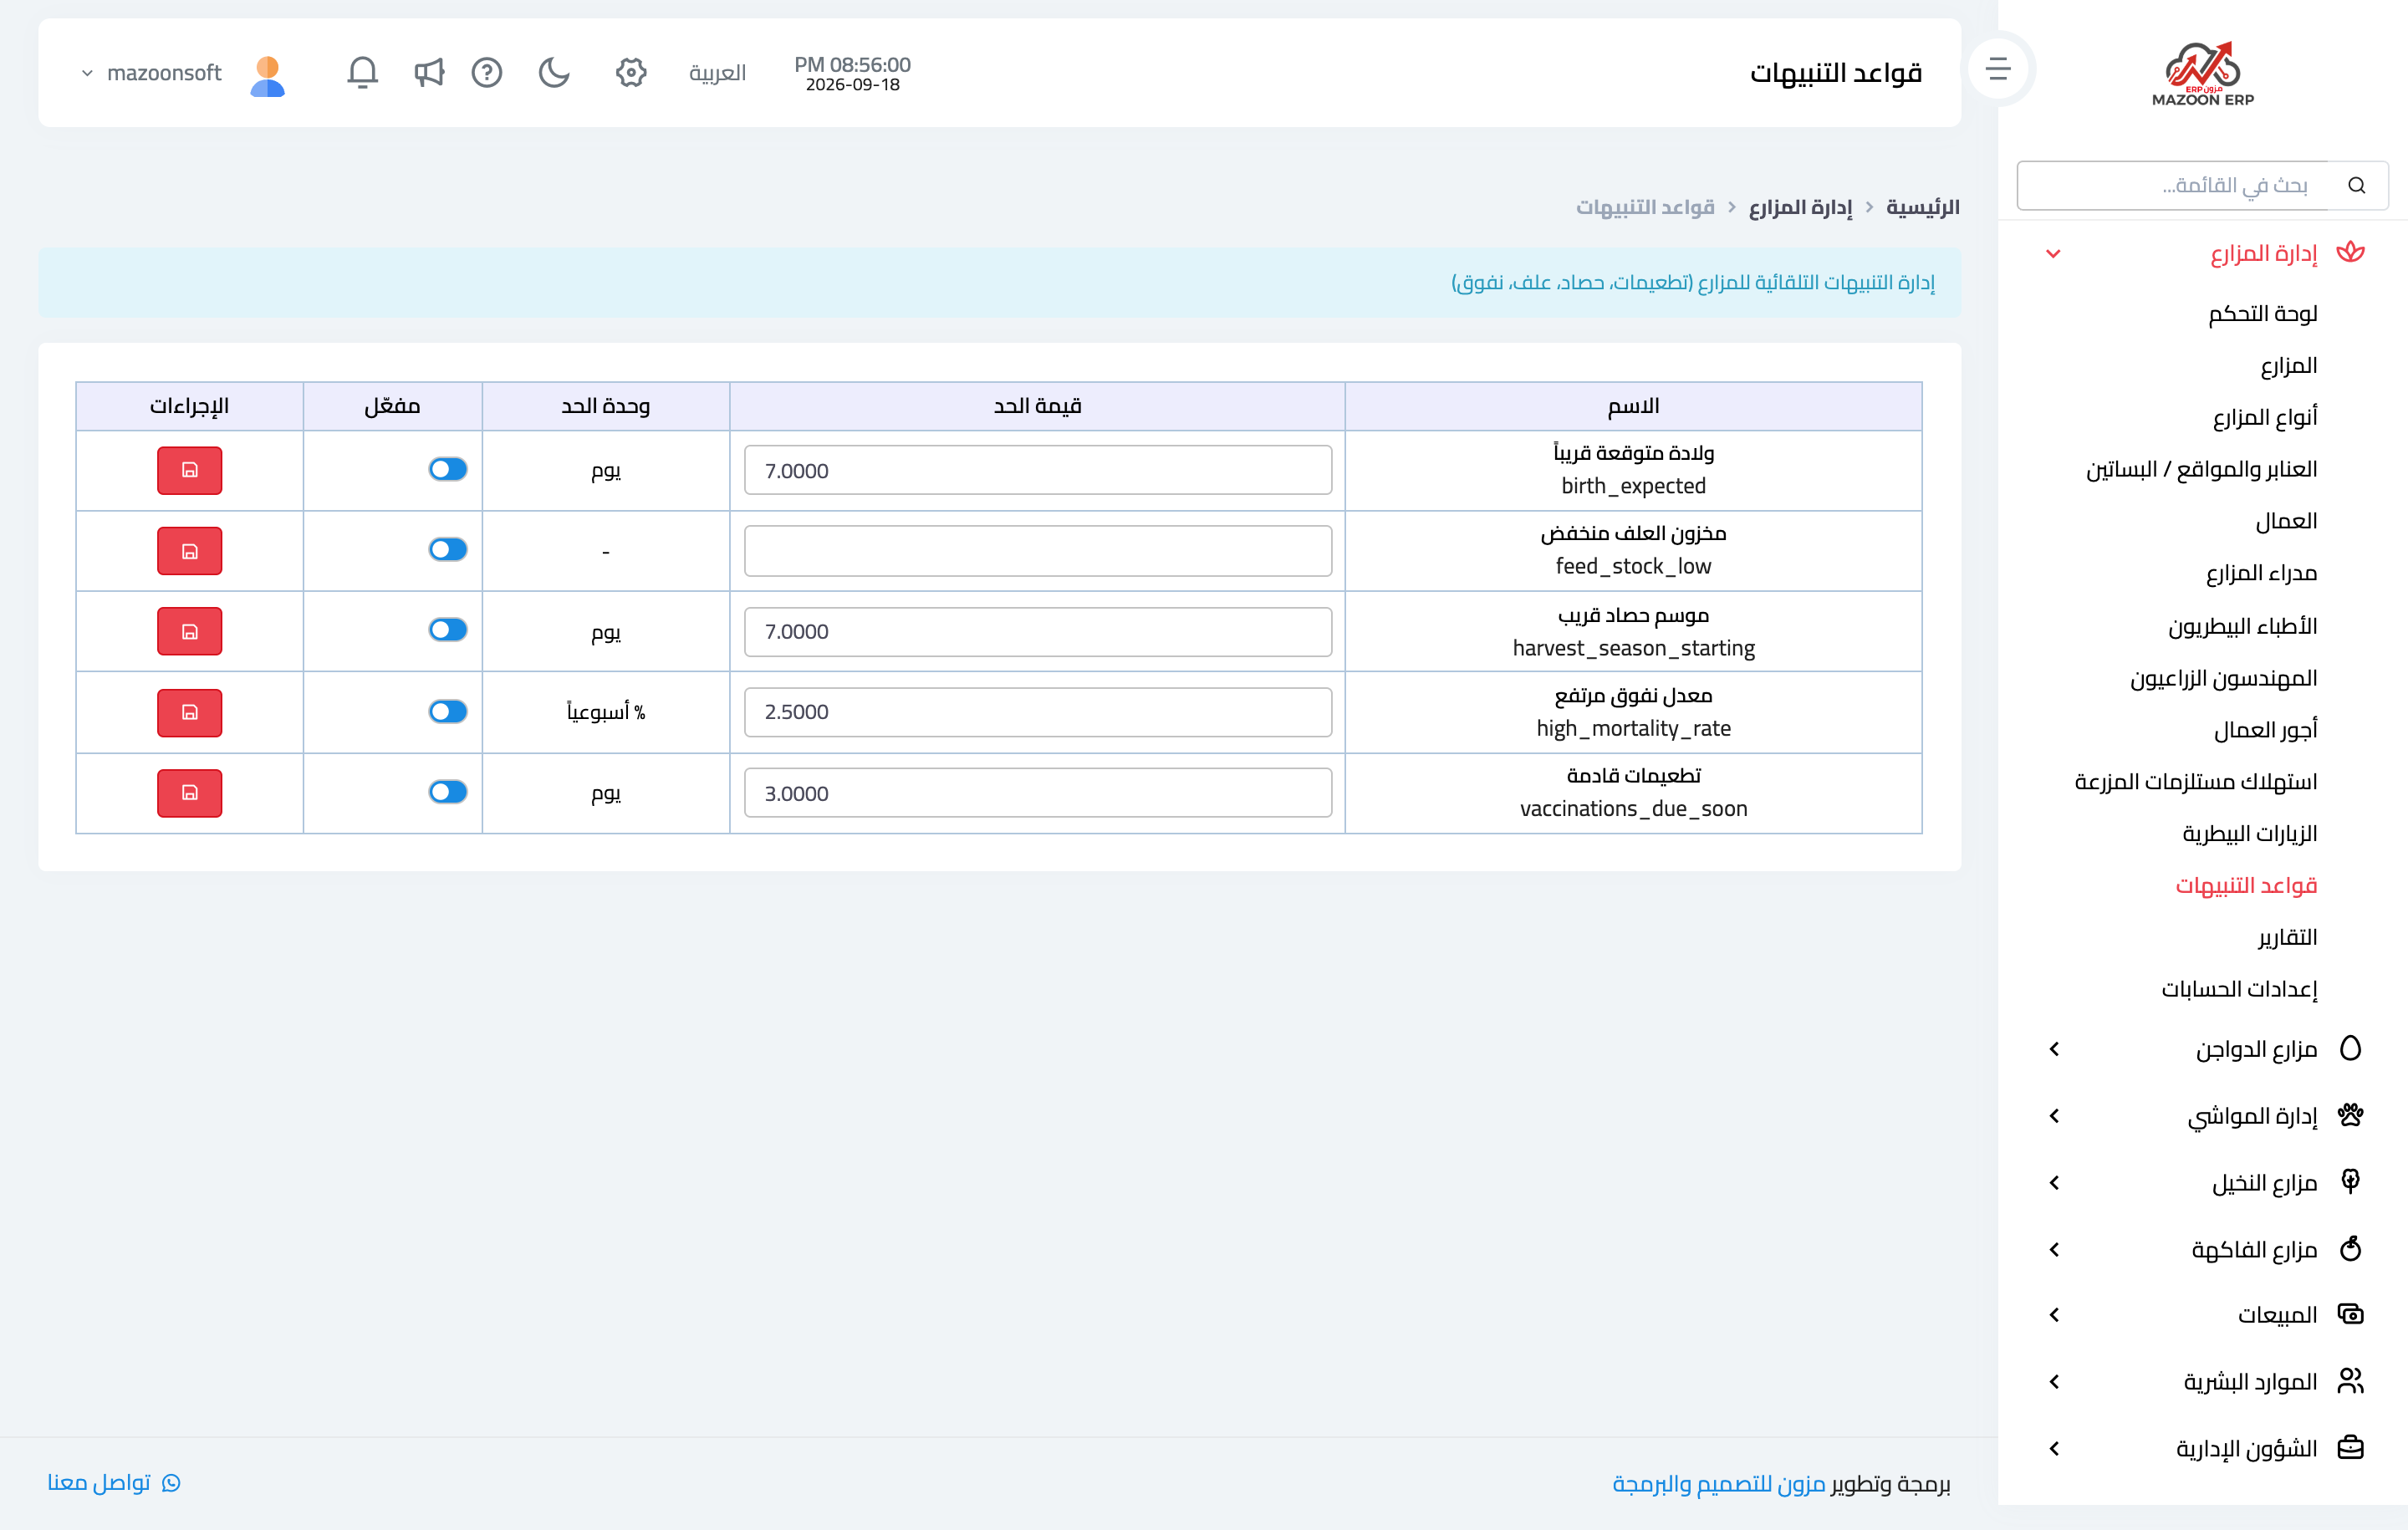
On the alert rules screen — Figure 9 — you set when the system warns you: a mortality rate that has risen, a vaccination that is late, production that has fallen. These are what turn the system from a ledger into a watchman.
Notes
- Create the farms and the locations before anything else; every flock, animal, and tree is assigned to a location.
- Do not make the farm one large location; separating the houses is what lets you see which house loses money and which one earns.
- Record input consumption as it happens; feed is the largest cost line and the quickest to slip out of the books.
- Enter the workers’ wages daily; gathering them at month end always ends in guesswork.
Screenshots
Try what you just read on your own data
Open a free 7-day trial — no credit card, with your own company link in minutes.