
Showroom reports: reading your numbers honestly
The reports screen gathers the showroom's picture in one place. But a number alone is not enough — what matters is knowing exactly what it measures and when it will mislead you.
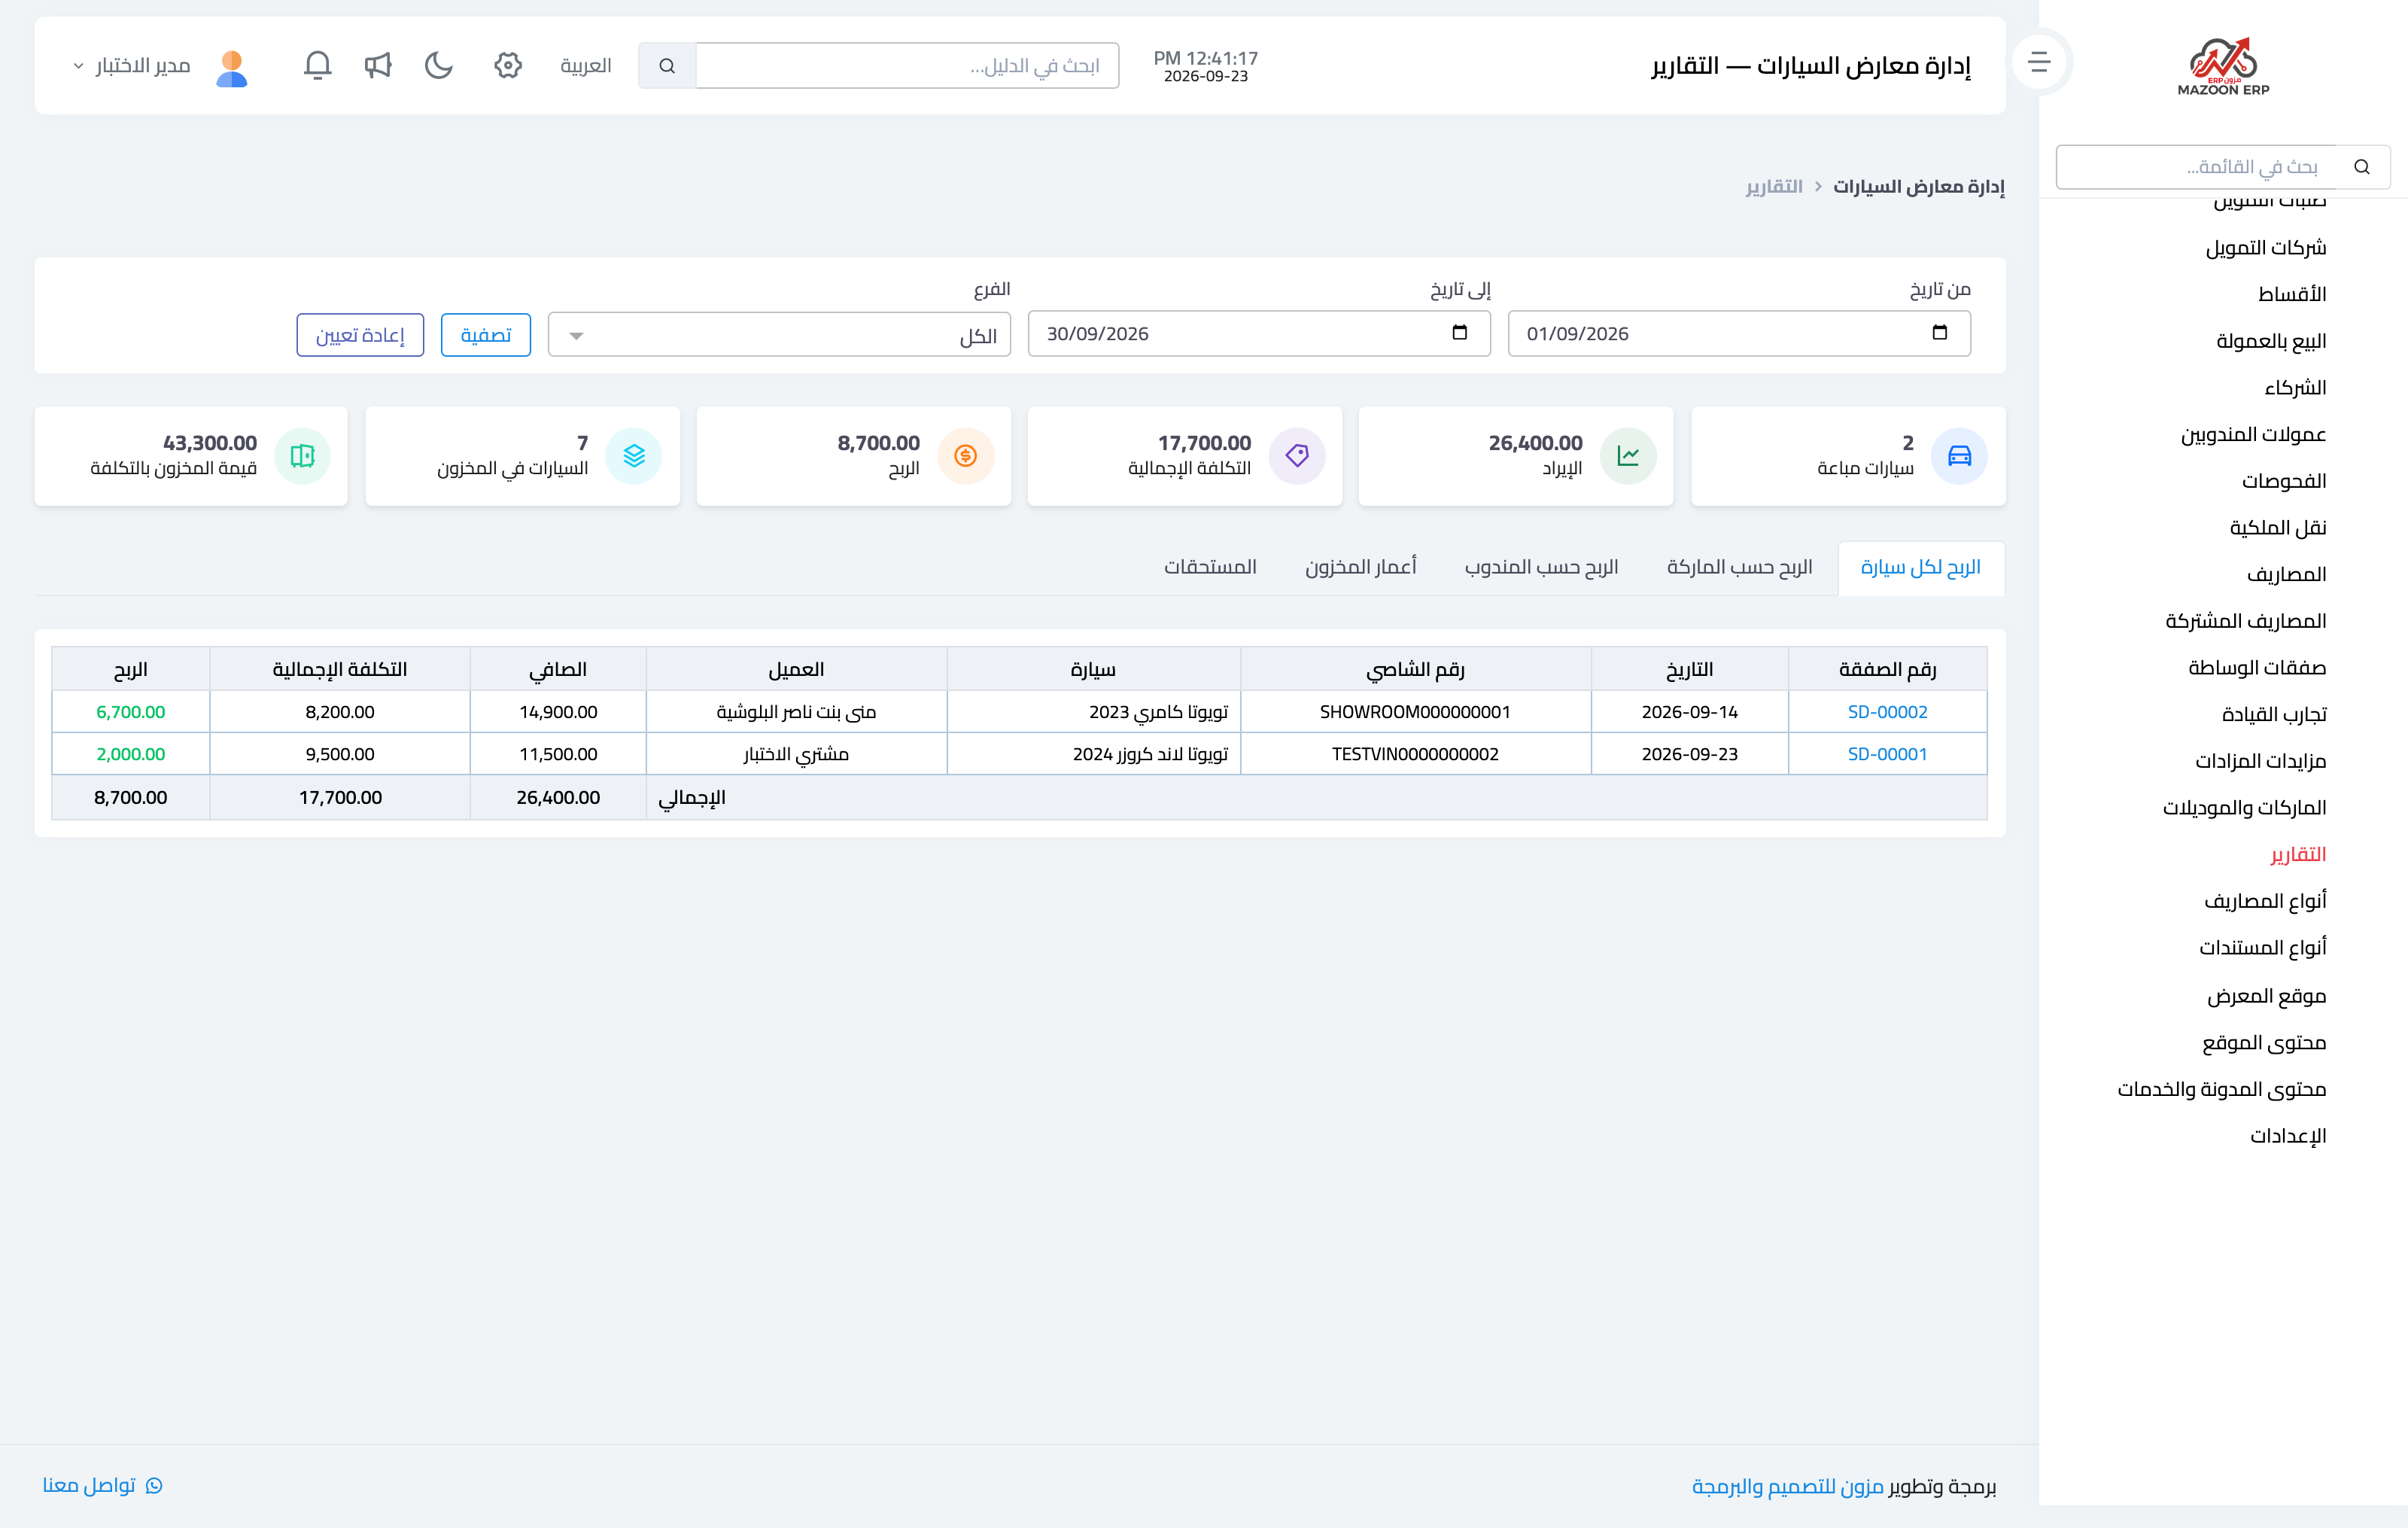
Image 1 — the reports screen.
The headline figures
- Cars in stock and stock value at cost: what you hold now and what it is worth at cost, not at its listing price.
- Cars sold, revenue, total cost and profit for the selected period.
The five tabs
- Profit per car: one row per sold vehicle showing sale price, cost and profit. This is the most honest report in the module, because it exposes cars sold at a thin margin or a loss even when the total looks healthy.
- Profit by make: which make actually earns for you. You may be surprised that your best-selling make is not your most profitable.
- Profit by salesperson: each seller's performance measured by profit, not deal count.
- Stock ageing: vehicles grouped by how long they have sat. An old car ties up capital even if it costs you nothing further.
- Receivables: what customers owe you (instalments and balances) and what you owe suppliers and partners.
The filters that change every figure
All the numbers are governed by the date period and the branch. Before comparing two reports, make sure their filters match — most reported "contradictions" come from comparing two different periods.
One thing worth knowing
Profit in these reports is measured on an accrual basis: a car counts as sold and its profit is recorded at invoicing, not when the money arrives. So if you sell on instalments, the profit recorded here is not cash in hand — check the receivables tab to see what has actually been collected.
Screenshots
Try what you just read on your own data
Open a free 7-day trial — no credit card, with your own company link in minutes.